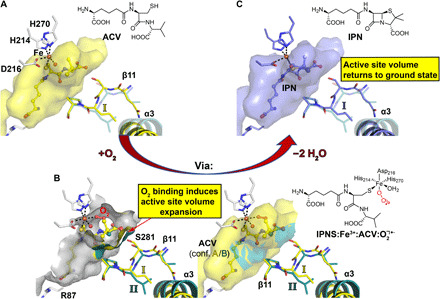
Fig. 6. Comparison of active site volume before and after O2 binding–induced rearrangement of β11 and α3.

Calculations of the active site volume were performed with PyVOL (61). (A) Active site volume presentation of the IPNS:Fe:ACV complex (yellow). The alternative conf. II obtained after O2 binding is in teal with high transparency. (B) Active site volume superimposition of the atomic model obtained from the single-crystal IPNS:Fe:ACV:O2 (PDB: 6ZAP) complex by cryo-cooled synchrotron data collection highlighting the two different conformations of β11 and α3 triggered by O2 binding. The two panels show the active site volume in an open (left) and closed (right) view. To perform active site volume calculations, either conf. A (ground state, yellow) or B (O2 bound, teal) was removed from the model. The active site volume after O2 binding (teal, 1374 Å3) appears to increase by 13 Å3 compared to conf. A, as obtained in the anaerobic ground state (yellow, 1361 Å3). Note that these changes appear solely in the region where the bond-breaking and bond-forming steps for penicillin formation are happening. (C) Active site volume presentation of the IPNS:Fe:IPN complex (blue). Since β11 in the IPNS:Fe:ACV and IPNS:Fe:IPN complexes superimpose identically (not shown), the active site volume returns back to its ground state after turnover. These observations suggest a controlled active site volume expansion during penicillin ring formation. The alternative conf. II obtained after O2 binding is shown in teal with high transparency.
