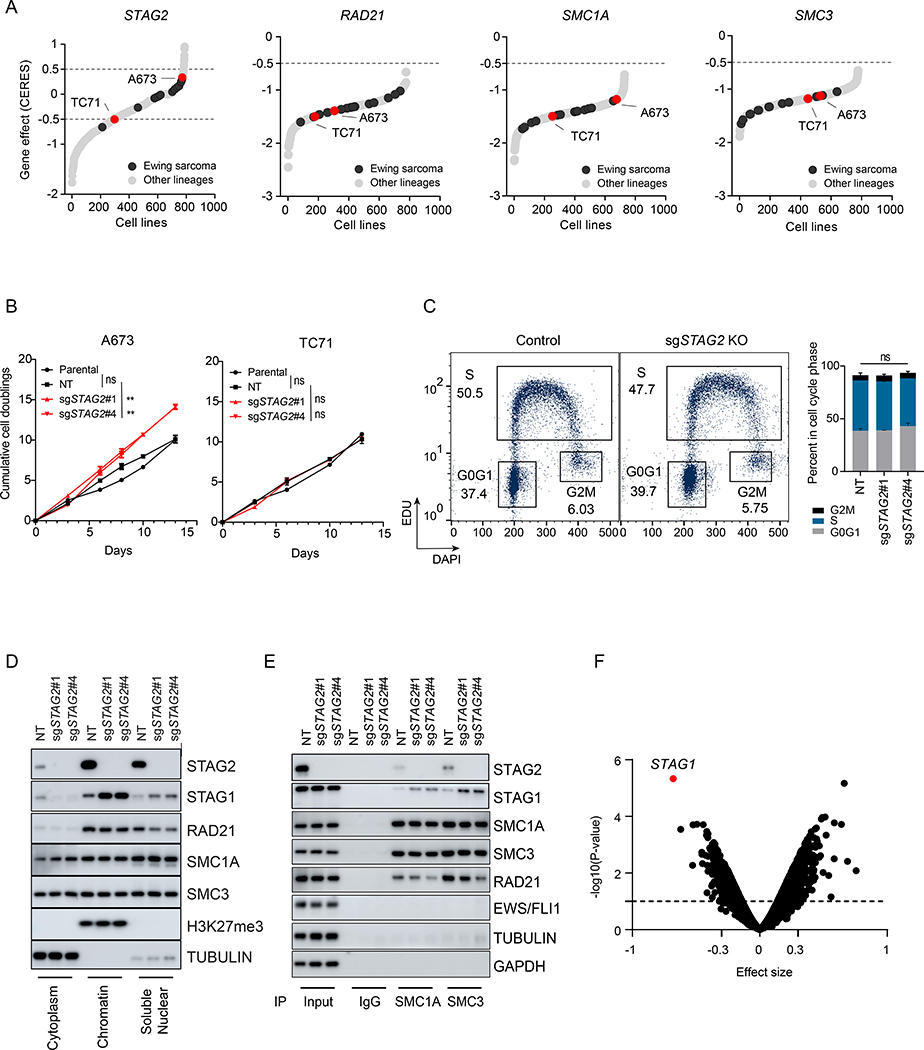
Figure 1. Loss of STAG2 does not consistently alter cell growth but changes the composition of the cohesin complex and renders cells sensitive to STAG1 deletion.
(A) Hockey plots depicting the distribution of STAG2, SMC1A, SMC3 and RAD21 gene effect (CERES) scores across the 789 cell lines in CRISPR (Avana) Depmap v20Q3 data. (B) Line graphs showing mean ± sd of cumulative doublings for parental or clonally selected non-targeting (NT) or STAG2 KO A673 and TC71 cells. Pairwise comparative analysis for exponential growth fitted curves (extra-sum-of-squares F test, ** P < 0.01, ns=not significant). (C) EdU incorporation-based cell cycle profiling and a representative flow cytometry plots (left) are shown. Two independent experiments as mean ± sd barplots (right). 2-way ANOVA ns=not significant. (D-E) Sub-cellular fractionation (D) or Immunoprecipitation with SMC1A, SMC3 or IgG (E) followed by western blot was performed for the indicated proteins. (F) Genome-scale CRISPR/Cas9 screen in isogenic NT and STAG2 KO A673 clonal cells. Shown is the volcano plot for gene effect size vs. −log10(P-value) for the genome-wide differential analysis of isogenic NT vs. STAG2 KO processed reads; dots represent genes (limma eBayes for MAGeCK gene effect scores, effect size ≤ −0.3, adjusted P ≤ 0.10). See also Figure S1.

