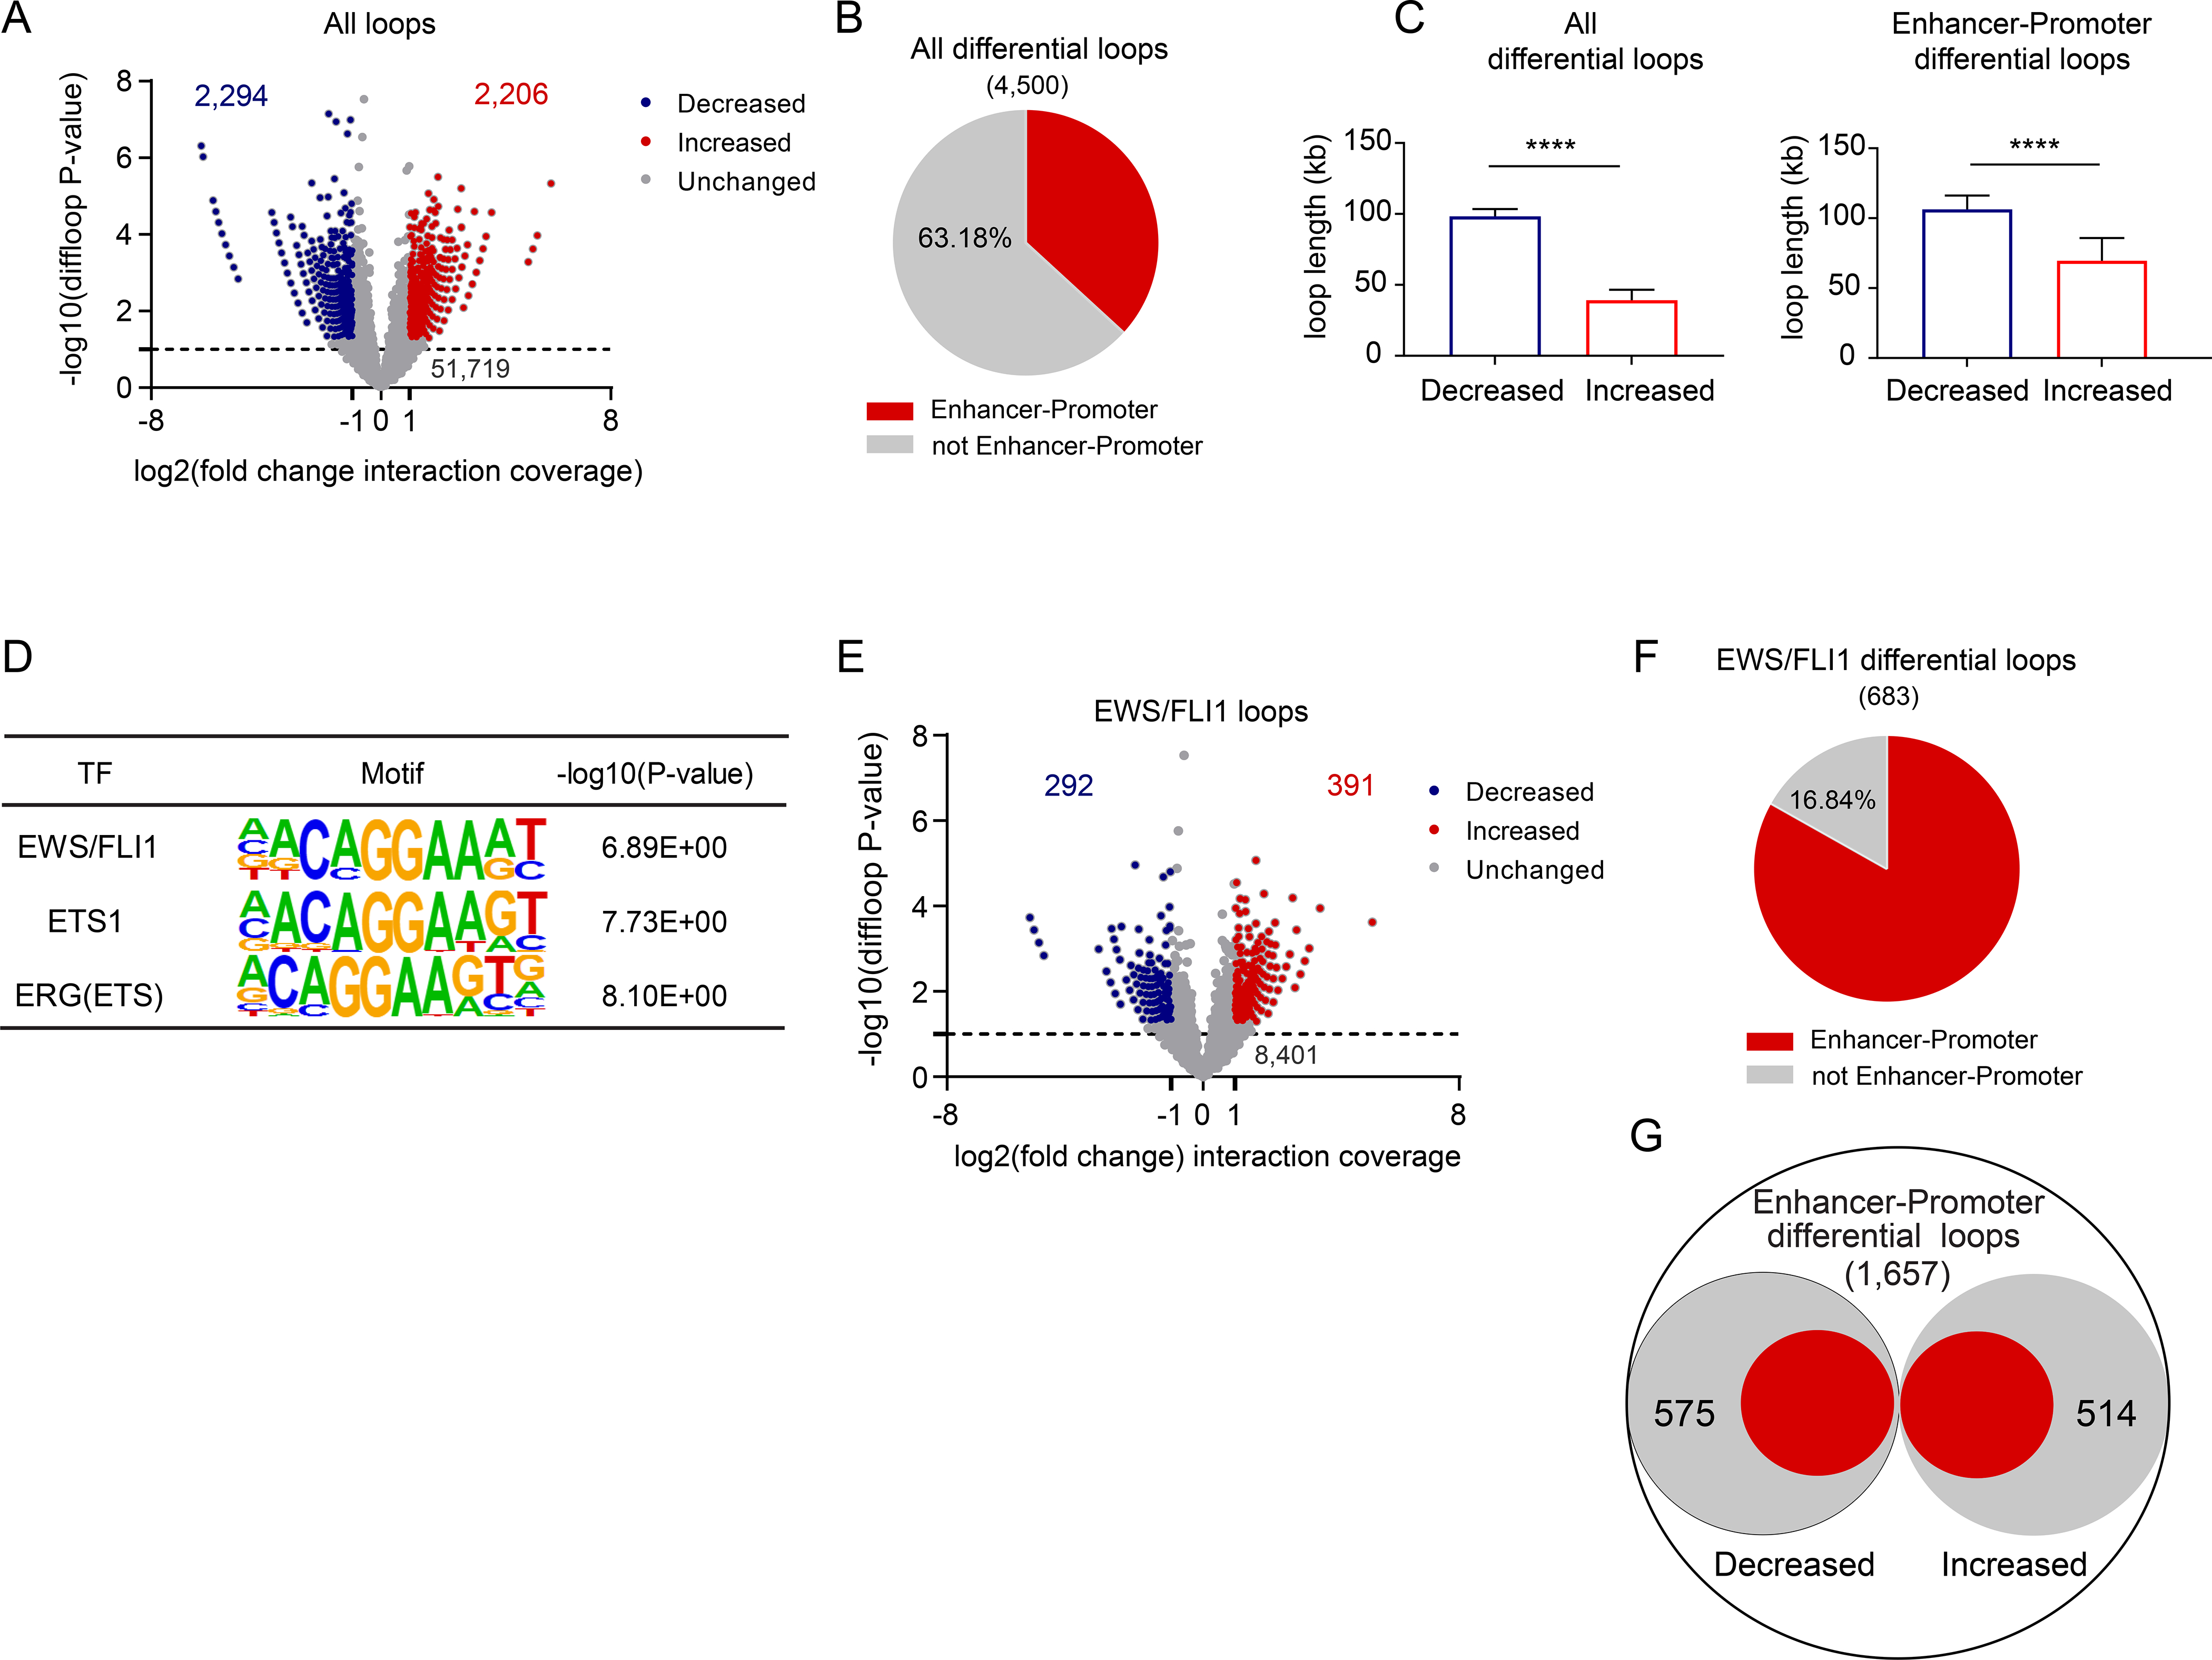
Figure 3. Loss of STAG2 alters the frequency of cis-chromatin contacts.

(A) Volcano plot of changes in chromatin loop strength comparing STAG2 WT to KO A673 cells based on SMC1A Hi-ChIP (edgeR over-dispersed Poisson regression, |(FC)|≥2, P≤ 0.05). (B) Pie chart depicting the fraction of differential loops involving enhancer-promoter interactions (two-tailed Fisher exact test, **** P < 0.0001). (C) Median + 95% confidence interval plots for lengths of differential loops (unpaired t-test with Welch correction, **** P < 0.0001). (D) Three of the top 10 enriched motifs for the enhancer regions involved in differential enhancer-promoter loops. (E) Volcano plot depicting the differential status of the 9,084 EWS/FLI1 anchored differential loops (edgeR over-dispersed Poisson regression, |fold change| ≥ 2, P ≤ 0.05). (F) Pie chart depicting the fraction of EWS/FLI1 anchored differential loops involving enhancer-promoter interactions. Two-tailed Fisher exact test, **** P < 0.0001. (G) Diagram depicting the fraction of EWS/FLI1 anchored enhancer-promoter interactions as a subset of all differential enhancer-promoter loops. Two-tailed Fisher exact test **** P < 0.0001. See also Figure S3, Tables S1 and S2.
