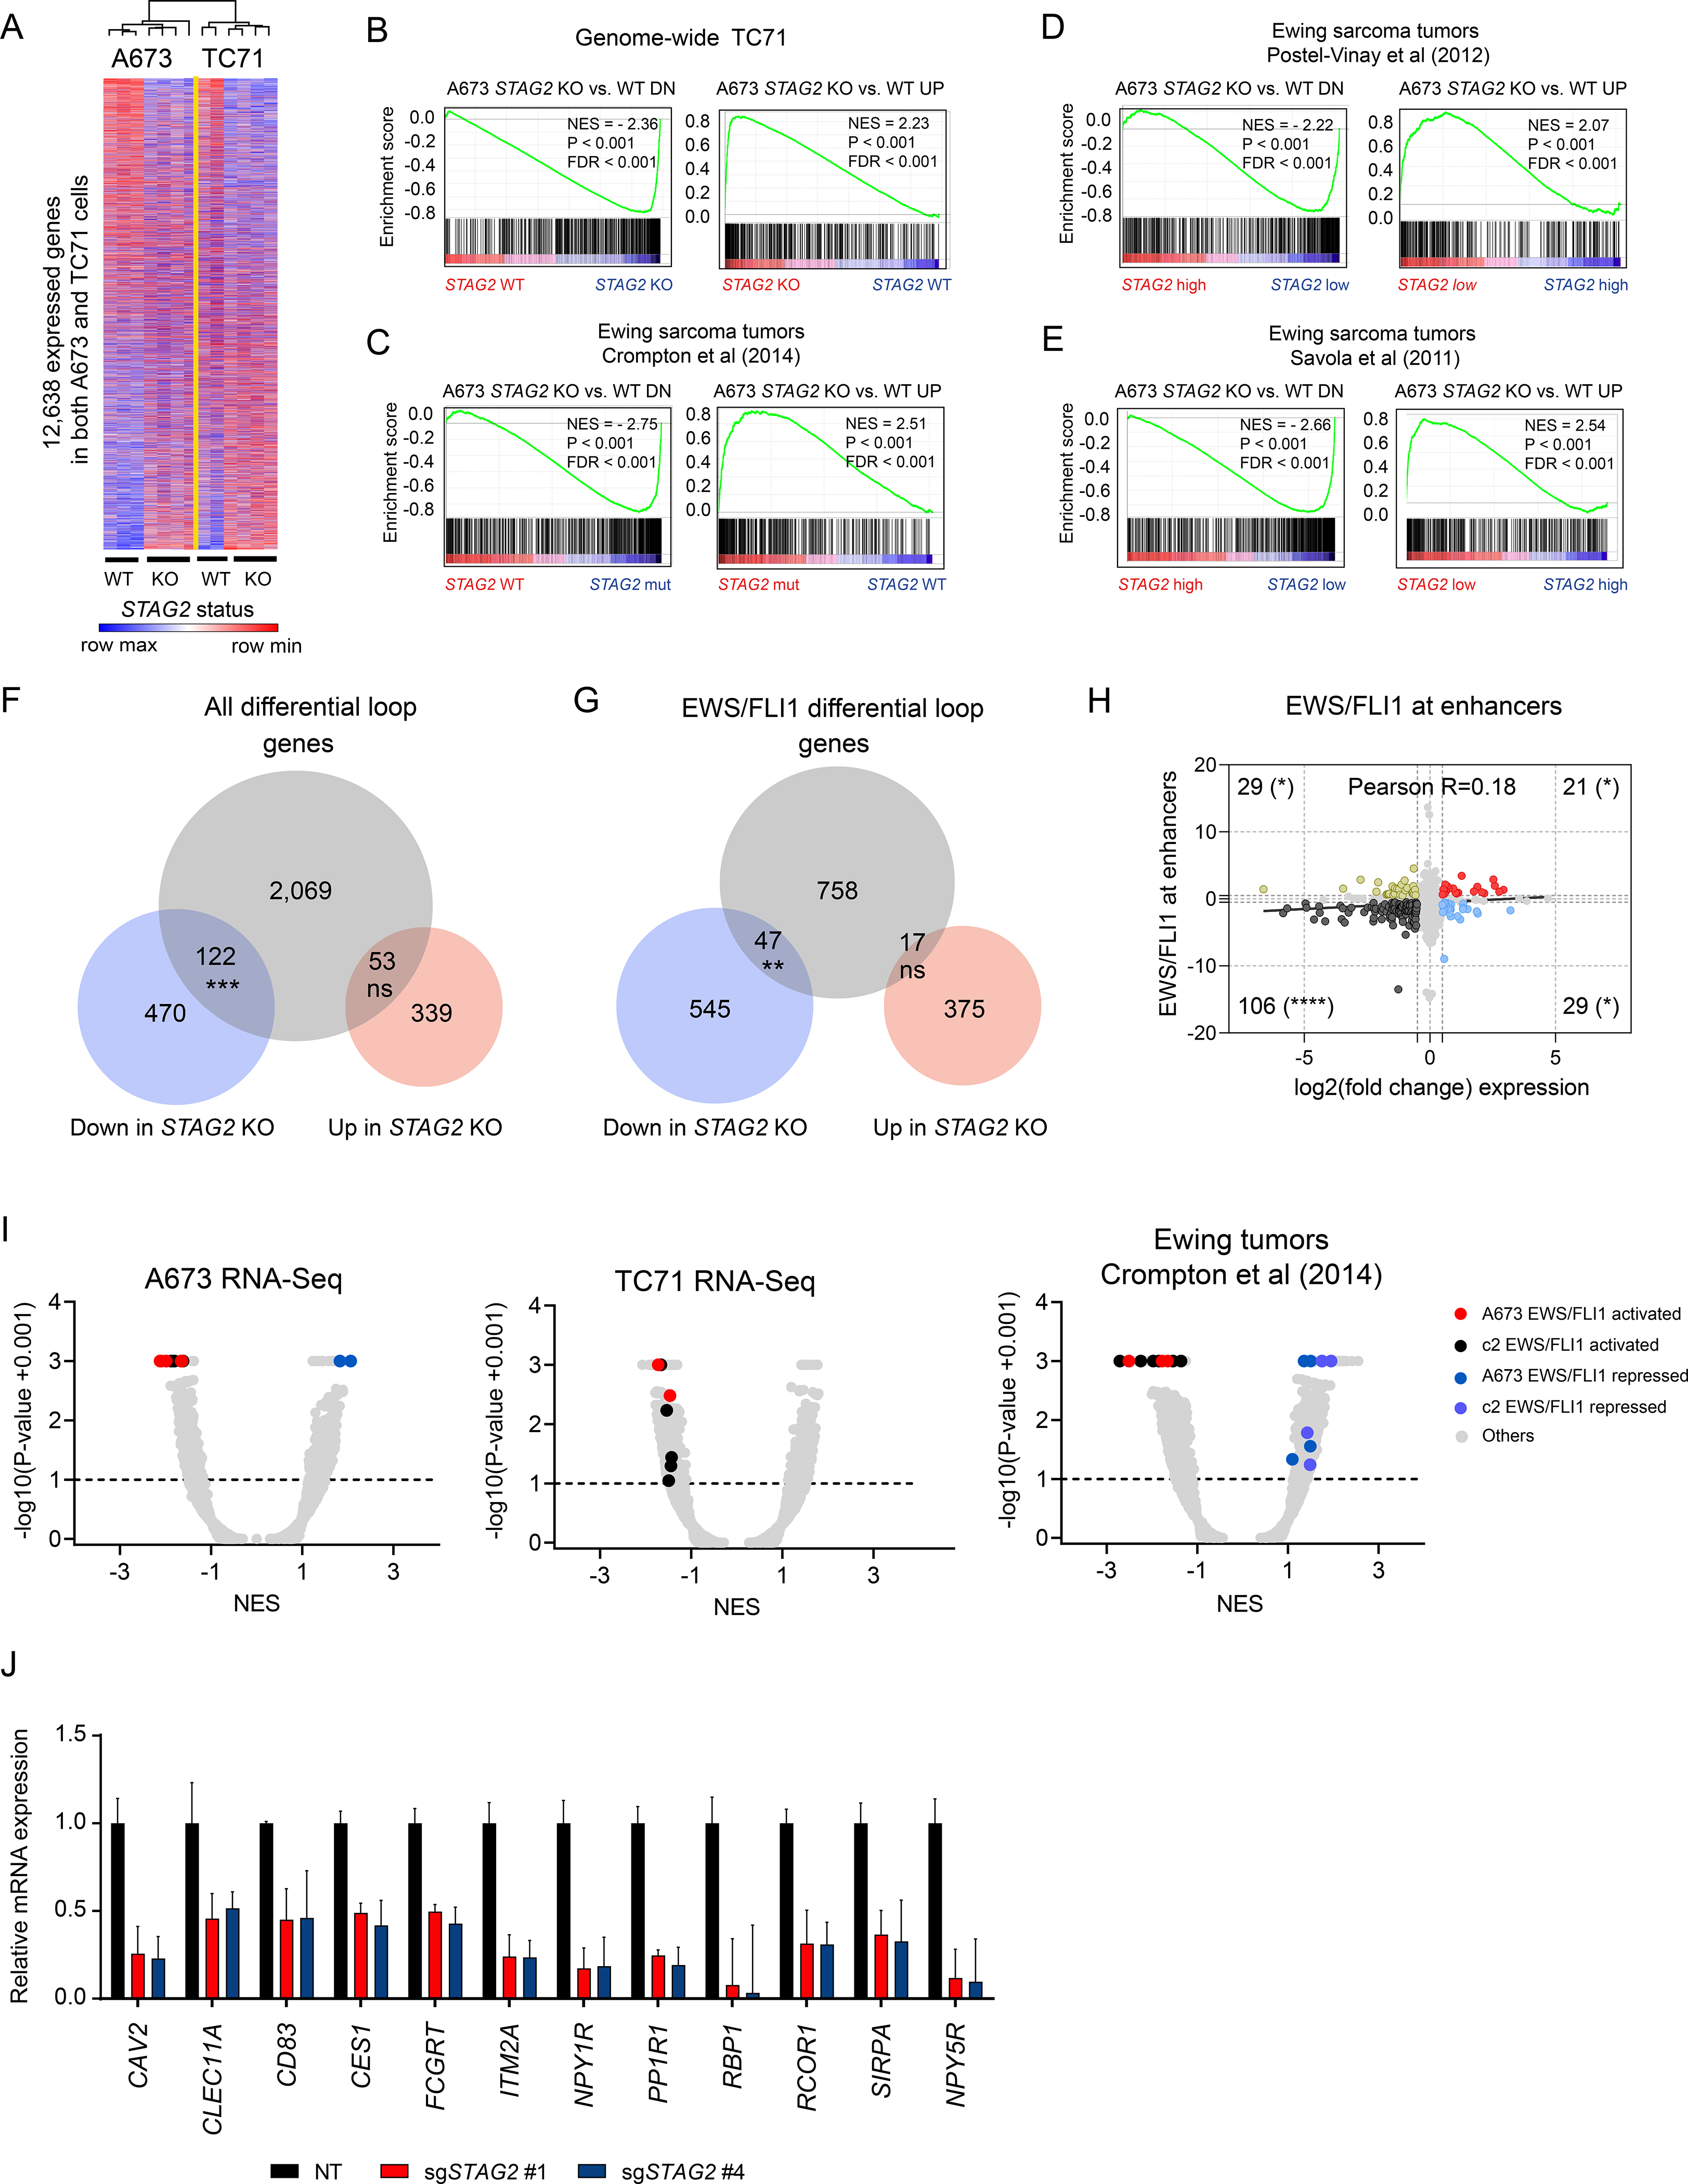
Figure 4. Loss of STAG2 alters the EWS/FLI1 driven oncogenic transcriptional program.

(A) Heatmap and average linkage dendrogram of genome-wide gene expression, log2(normalized counts), in STAG2 KO vs. WT A673 and TC71 cells. (B-E) GSEA plots demonstrating the enrichment of the STAG2 KO vs. WT gene signature for A673 cells in the genome-wide expression changes induced by STAG2 KO in TC71 cells (B) or in three distinct Ewing sarcoma primary patient tumor datasets (C-E). Normalized enrichment score, P-value and FDR are indicated in each plot. (F) Venn diagram depicting the overlap between differentially expressed genes with genes harboring a differential loop within 5kb of their TSS. (Two-tailed Fisher exact test, *** P < 0.001, ns = not significant). (G) Similar analysis as in (F) is shown for EWS/FLI1 anchored differential loops (Two-tailed Fisher exact test, ** P < 0.01, ns = not significant). (H) Scatter plot depicting the overlap between gene expression change and EWS/FLI1 binding at the nearest enhancer assessed by ChIP-seq. Two-tailed Fisher exact test (**** P < 0.0001, * P < 0.05). (I) Volcano plots for GSEA enrichment scores for the genome-wide expression changes induced in A673 and TC71 and by STAG2 mutant vs. STAG2 WT tumor samples from (Crompton et al., 2014) vs. the union of a collection of 12 EWS/FLI1 public gene signatures in A673 cells and MSigDB v7.1 c2 pathways (5,529 gene sets). (J) RT-QPCR based validation of a subset of EWS/FLI1 target genes repressed in STAG2 KO relative to control A673 cells. Data shown as mean ± SD. See also Figure S4 and Table S3.
