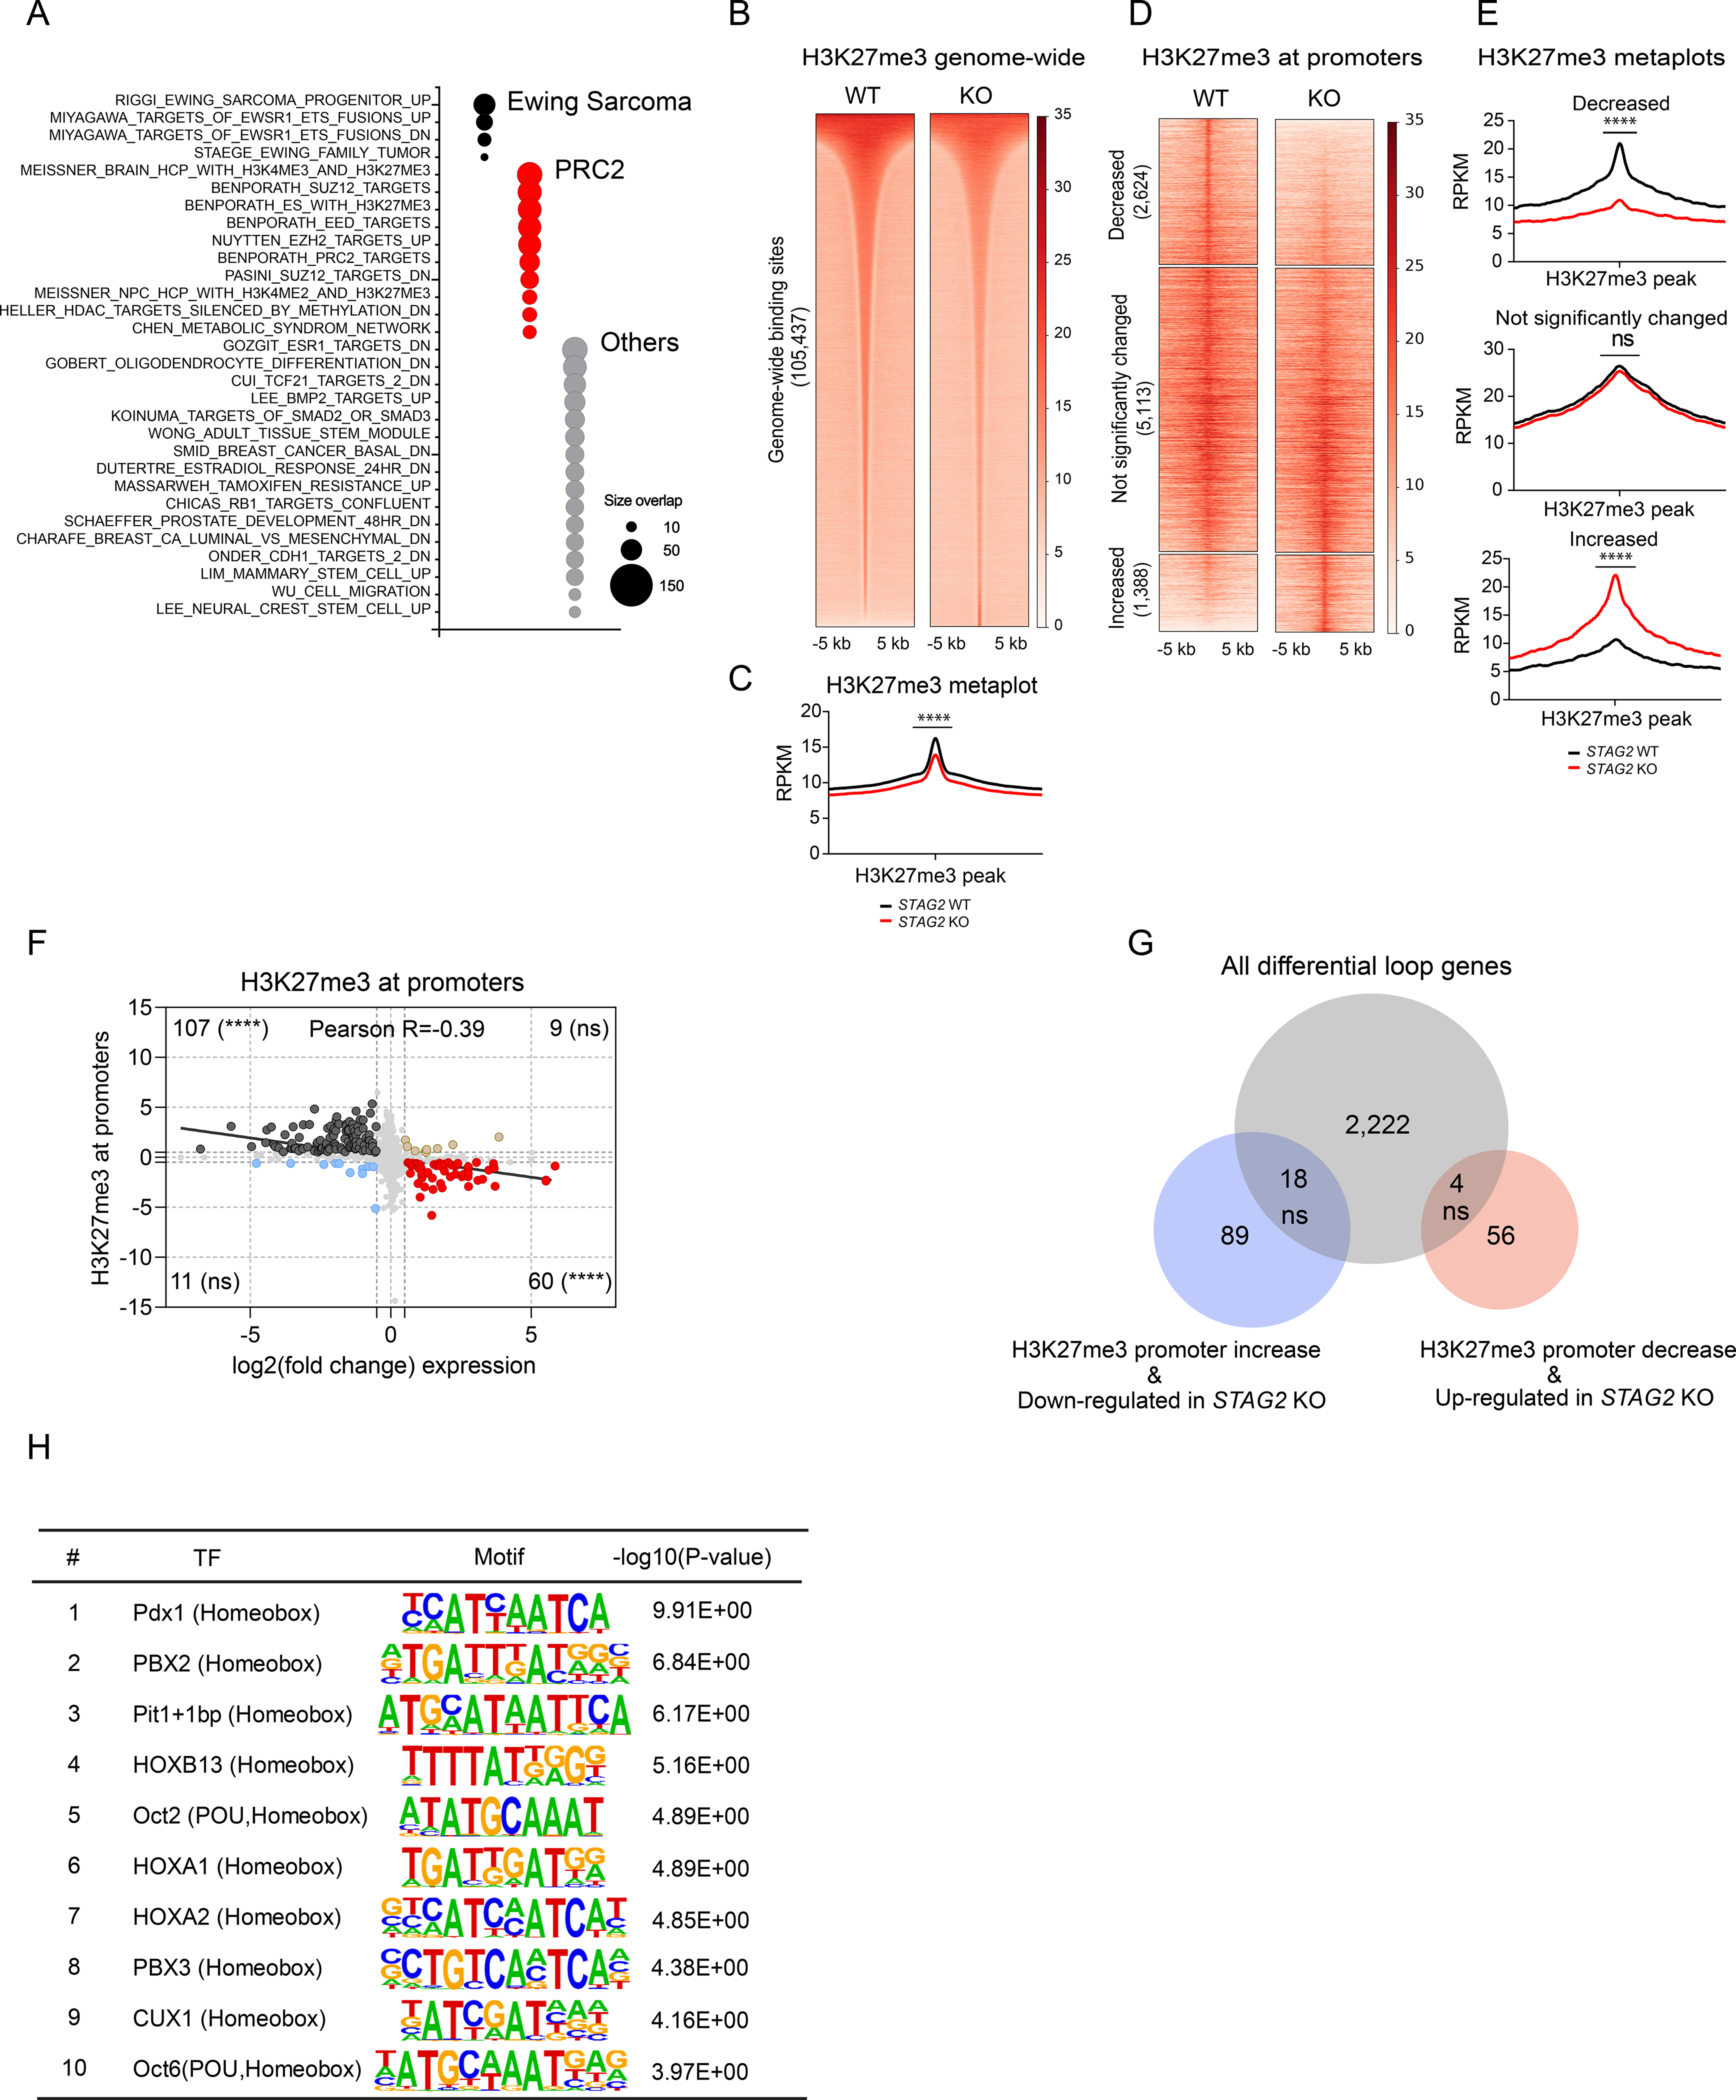
Figure 5. Loss of STAG2 perturbs PRC2-mediated regulation of gene expression.

(A) Bubble plot summarizing top 50 significant enrichments (size overlap≥25, P≤0.05, FDR≤0.05) for the MSigDB v7.1 c2 collection. Enriched gene sets are clustered in representative functional categories. (B) Genome-wide heatmaps of H3K27me3 ChIP-Seq signal in A673 cells expressing WT or STAG2 KO centered on significant peaks identified in either or both conditions. (C) Metaplots showing average genome-wide H3K27me3 signal in STAG2 KO and WT A673 cells. (unpaired t-test with Welch’s correction, **** P < 0.0001). (D) Clustered heatmaps depicting TSS +/− 5kb promoter regions with decreased, not significantly changed, or increased H3K27me3 ChIP-Seq binding in STAG2 KO vs. WT A673 cells (|Delta(area under curve signal)| ≥ 1.5). (E) Metaplots showing average H3K27me3 signal in the promoter regions defined in Figure 5C. Differential read density for STAG2 KO vs. WT A673 within clusters (unpaired t-test with Welch’s correction, **** P< 0.0001, ns = not significant). (F) Scatter plot depicting the overlap between the genes with significant change for H3K27me3 ChIP-Seq binding at promoter regions with differentially expressed genes. Two-tailed Fisher exact test, **** P < 0.0001, ns = not significant. (G) Venn diagram showing the overlap between the subset of genes with concurrent changes in expression and H3K27me3 levels at the promoter (shown in Figure 5F) with the total list of genes harboring a differential loop within 5kb of the TSS. Two-tailed Fisher exact test, ns = not significant. (H) List of top 10 enriched motifs at the promoters of genes with altered H3K27me3 levels in STAG2 KO cells. See also Figure S5, Tables S5 and S6.
