
Figure 7. The neurodevelopmental transcription factor POU3F2 modulates the metastatic potential of STAG2 KO Ewing sarcoma cells.
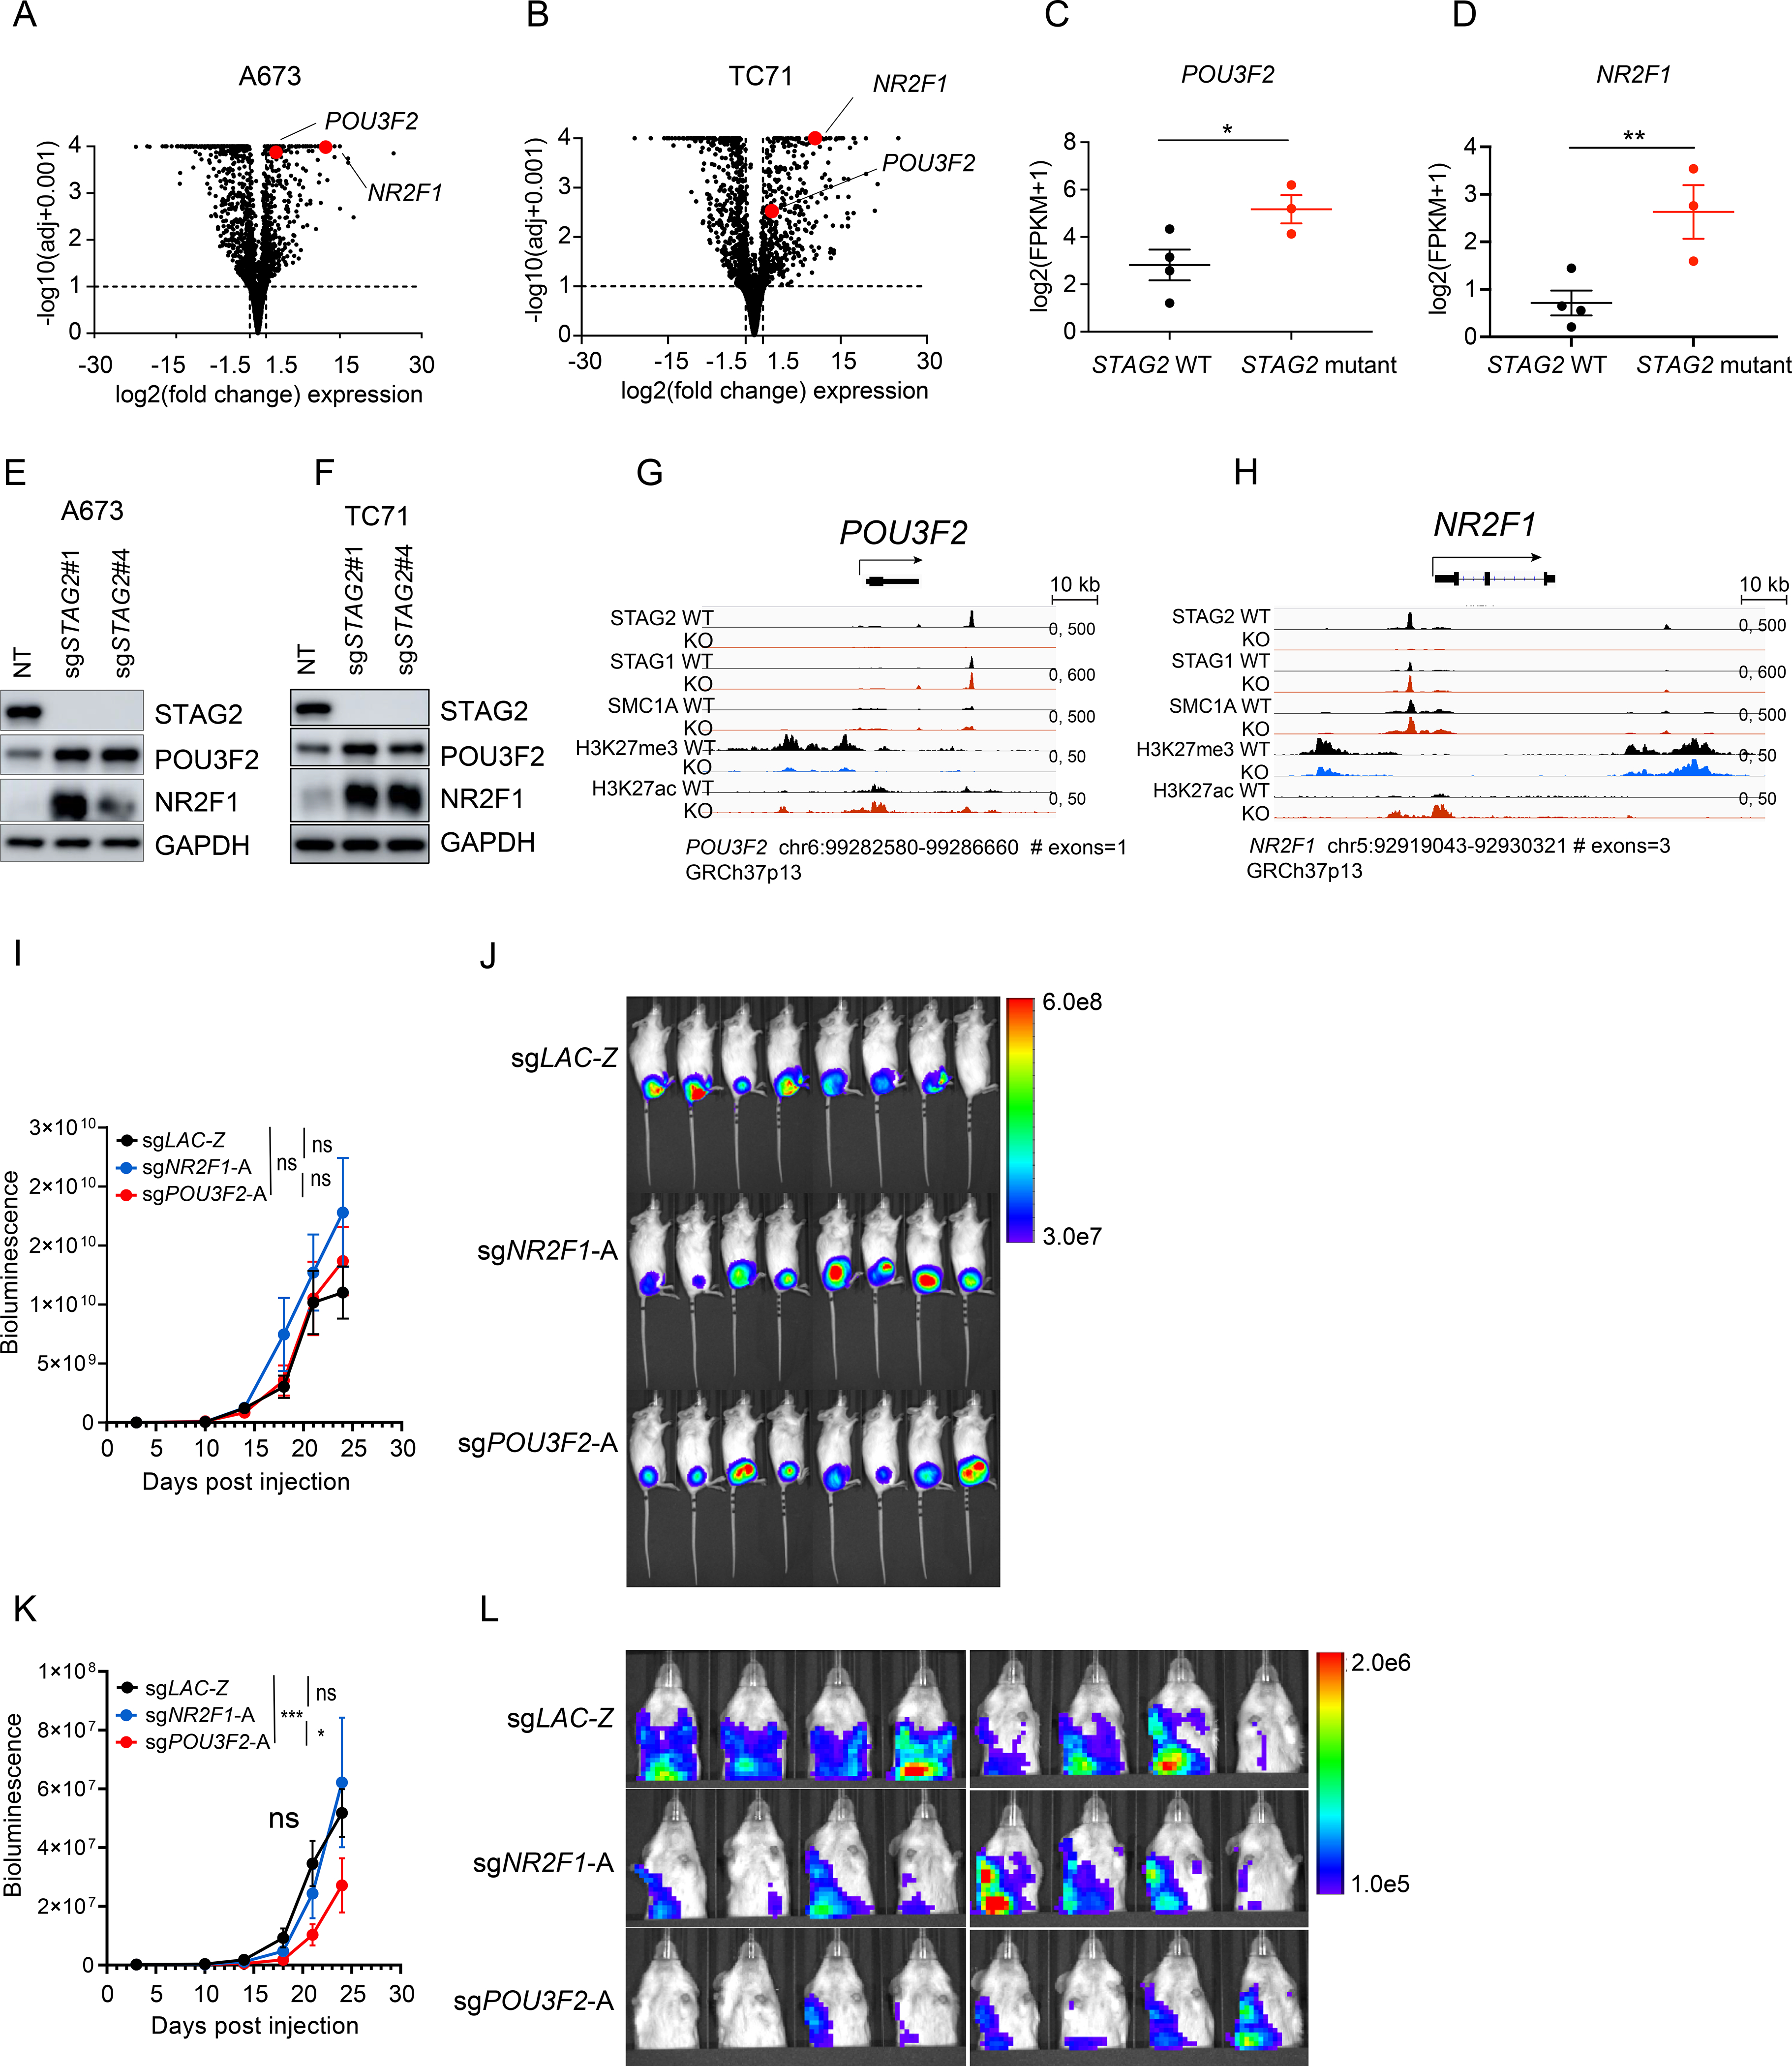
(A-B) Volcano plot depicting the transcriptional changes induced by STAG2 KO vs. control in (A) A673 and (B) TC71 cells. POU3F2 and NR2F1 are highlighted in red. Significance cutoffs: |log2(FC)| ≥ 1.5, adjusted P ≤ 0.10). (C-D) Scatter dot plot depicting the mean ± SEM mRNA log2(FPKM+1) expression of (C) POU3F2 and (D) NR2F1 in three STAG2 mutant tumors vs. the top four STAG2 WT tumors with highest STAG2 expression from (Crompton et al., 2014) data. Mann-Whitney non-parametric t-test (** P < 0.001, * P < 0.05). (E-F) Validation of an increase in POU3F2 and NR2F1 protein levels in (E) A673 and (F) TC71 cells clonally selected for STAG2 loss. (G-H) Integrated genomics viewer track showing SA2, SA1, SMC1, H3K27me3 and H3K27ac signals at the (G) POU3F2 and (H) NR2F1 locus in control and STAG2 KO A673 cells. (I) Quantification of bioluminescence signal for whole body. Line graph represents mean ± SEM, N = 8 per group (2-way ANOVA, ns = not significant). (J) Bioluminescence images of mice described in Figure 7I. (K) Quantification of bioluminescence signal for upper thoracic cavity after blocking the primary tumor at the lower abdomen. Line graph represents mean SEM, N = 8 per group (2-way ANOVA, *** P < 0.001, * P < 0.05, ns = not significant). (L) Bioluminescence images of mice described in Figure 7K. See also Figure S7.