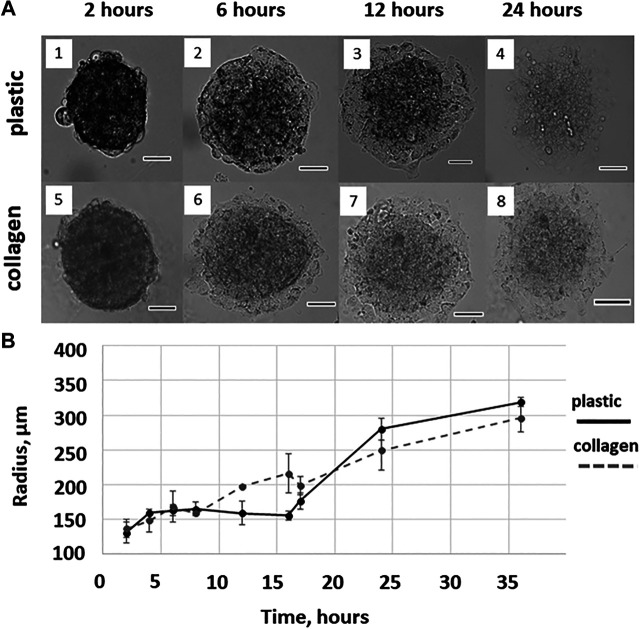
FIGURE 1.
Cell migration from the MCTS on plastic and collagen gel. (A) Representative images of MCTS cultured on plastic or collagen for 2, 6, 12, and 24 h (1,2,3,4 and 5,6,7,8, respectively). Scale is 100 μM (B) The mean radius covered by the cells migrating from single MCTS on plastic or collagen gel. The curves represent combined data from two independent experiments and three to nine technical replicates per time point. The data are presented as the mean ± SD.

