FIGURE 3.

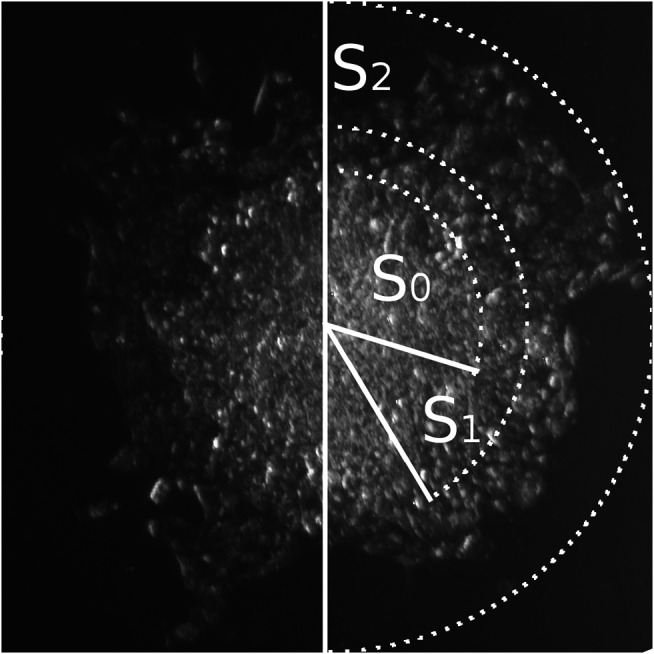
Three zones of cellular migration from MCTS. Representative image of the MCTS on plastic at the time point 24 h with zonal segmentation to S0, S1, and S2 areas characterized by different optical density of cell layers.

Three zones of cellular migration from MCTS. Representative image of the MCTS on plastic at the time point 24 h with zonal segmentation to S0, S1, and S2 areas characterized by different optical density of cell layers.