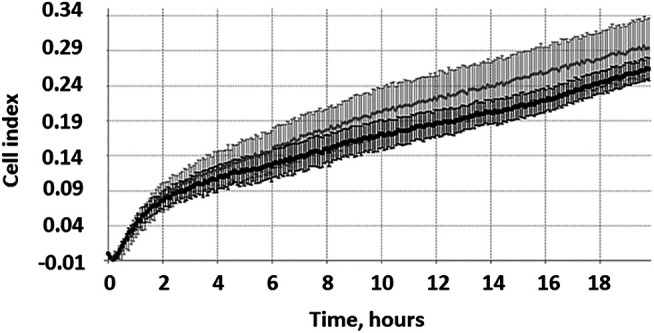
FIGURE 7.

RTCA measurements of growth kinetics of the area inhabited by the cells migrating from single and multiple MCTS on plastic. Representative image of growth kinetics for single MCTS (gray curve) and multiple MCTS (black curve) normalized by control (empty well). The data are presented as the mean ± SD. Representative data from two of 12 repeats in two runs.
