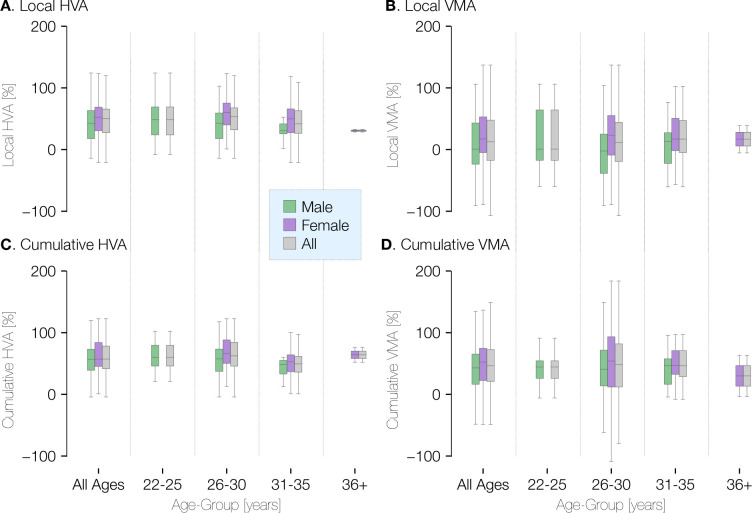
Appendix 1—figure 1. Visual field asymmetry in terms of age and gender at ±20° of polar angle.
Plots of the local (top row) and cumulative (bottom row) asymmetry across subjects in terms of age and gender. The percent horizontal-vertical asymmetry (HVA: horizontal ROI surface area minus vertical ROI surface area, divided by the mean surface area across horizontal and vertical ROIs) is shown in the left column, and the vertical meridian asymmetry (VMA: upper vertical ROI surface area minus lower vertical ROI surface area, divided by the mean surface area across upper and lower ROIs) is shown in the right column. Box-plots show the median (central horizontal line), quartiles (shaded box), and ±95% percentiles (lines).

