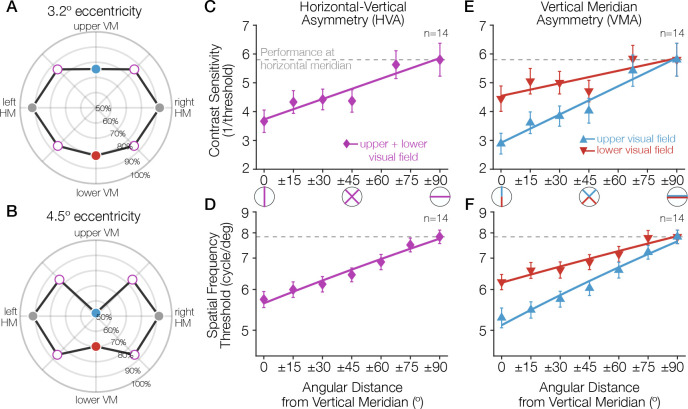
Figure 1. Task performance around the visual field.
(A, B) Performance for a Gabor-orientation discrimination task is shown in polar coordinates. The plotted angle indicates the polar angle of the tested stimulus location, and the distance from the origin indicates the performance (percent correct) at that polar angle. The origin indicates chance performance. Gabor patches were presented at either (A) 3.2° or (B) 4.5° of eccentricity, with a spatial frequency of 10 and 12 cycles/deg, respectively. The HVA and VMA are evident in both plots and the asymmetries are more pronounced at the farther eccentricity (Carrasco et al., 2001). (C–E) As the angular distance from the vertical meridian increases, averaged across upper and lower, performance gradually improves, approaching the performance level at the horizontal (C, D), and the difference in performance between the upper and lower hemifields reduces (E, F). These gradual changes around the visual field have been observed for contrast sensitivity (Abrams et al., 2012) (C, E; at 6° eccentricity) and acuity limit (Barbot et al., 2021) (D, F; at 10° eccentricity). Each data point corresponds to the average contrast sensitivity (or spatial frequency threshold) at a given angular location, with ±1 SEM across observers. Spatial frequency was measured as the point at which orientation discrimination performance dropped to halfway between ceiling and chance performance. Redrawn using data from Carrasco et al., 2001; Abrams et al., 2012 and Barbot et al., 2021. HVA, horizontal-vertical asymmetry; VMA, vertical meridian asymmetry.

