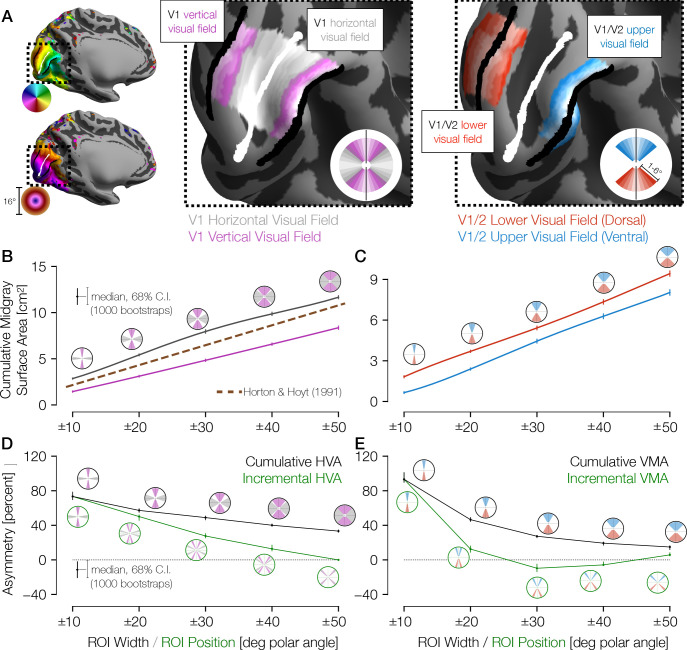
Figure 2. Cortical surface areas around the visual field.
(A) Polar angle (top left) and eccentricity (bottom left) maps for example HCP subject 177746. The V1/V2 boundaries and the V1 horizontal meridian obtained via Bayesian inference are shown as black and white lines, respectively. The middle panel of A shows ROIs drawn with gradually increasing polar angle widths centered around the horizontal meridian (gray) and the vertical meridian (V1/V2 boundary; magenta), limited to 1–6° of eccentricity in V1 only. The right panel shows ROIs around the upper vertical meridian (ventral V1/V2 boundary; blue) and the lower vertical meridian (dorsal V1/V2 boundary; red) that include both V1 and V2. In this hemisphere, the cortical surface area is greater near the horizontal than the vertical meridian and near the lower than the upper vertical meridian. (B) Mid-gray surface area for increasingly large ROIs centered on the vertical (magenta) or horizontal (gray) meridian. The error bars indicate the 68% confidence intervals (CIs) from bootstrapping. The circular icons show the visual field representations of the ROIs for the nearby data points. The x-values of data points were slightly offset in order to facilitate visualization. The brown dotted line shows the equivalent V1 ROI surface area as predicted by Horton and Hoyt, 1991. (C) Same as B, but for upper (blue) and lower (red) vertical meridians. (D, E) The surface areas are transformed to percent asymmetry, both for the cumulative ROIs (black) and incremental ROIs (green). Whereas cumulative ROIs represent a wedge of the visual field within a certain polar angle distance ± θ of a cardinal axis, incremental ROIs represent dual 10°-wide wedges in the visual field a certain polar angle distance ±θ from a cardinal axis. The percent asymmetry of x to y is defined as 100× (x−y)/mean(x, y). Positive values indicate greater area for horizontal than vertical (D) or for lower than upper regions (E). ROI, region of interest.


