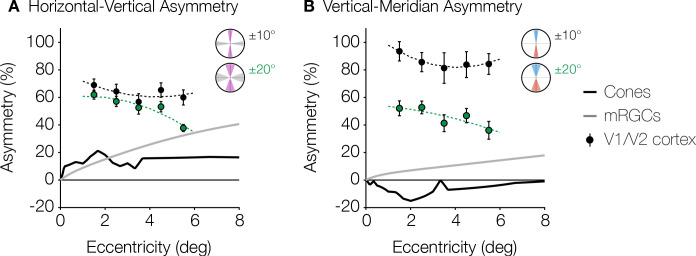
Figure 5. Asymmetries from retina and visual cortex.
(A) HVA and (B) VMA for cone density (black line) and mRGC density (gray line) when comparing the cardinal meridians, and V1/V2 cortical surface area within the ±10° ROIs (black markers) and ±20° ROIs (green markers) as a function of eccentricity. Cone density data are in counts/deg2 (Curcio et al., 1990). Midget RGC densities represent the receptive field counts/deg2 using the quantitative model by Watson, 2014. V1/V2 cortex data are calculated from the cortical surface area in mm2/deg2 within 1° non-overlapping eccentricity bands from 1° to 6° of the ±10° and ±20° ROIs. Markers and error bars represent the median and standard error across bootstraps, respectively. Data are fitted with a second-degree polynomial. HVA, horizontal-vertical asymmetry; RGC, retinal ganglion cell; ROI, region of interest; VMA, vertical meridian asymmetry.

