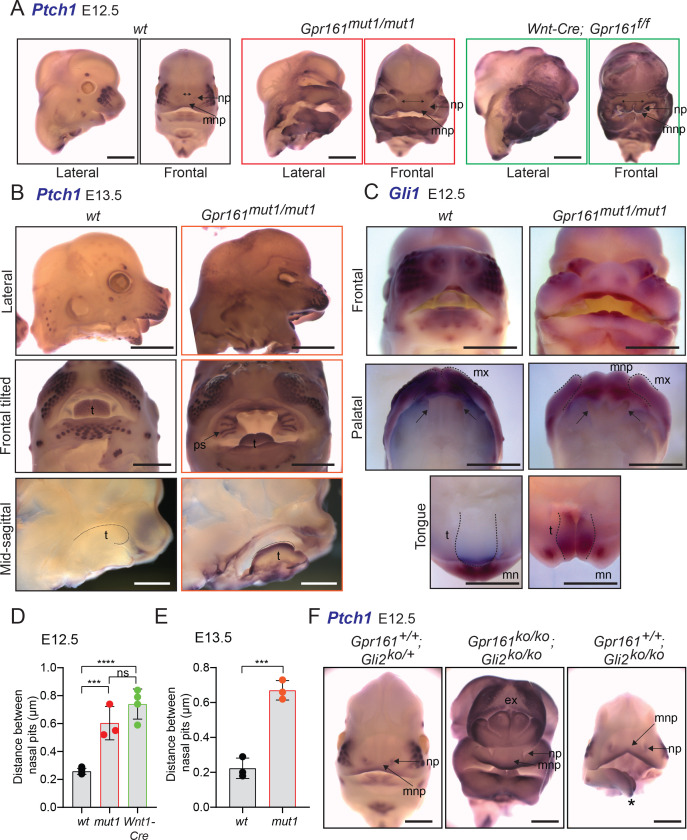
Figure 7. Gpr161mut1/mut1 embryos show high Hh signaling and mid face widening.
(A) RNA in situ hybridization for Ptch1 in wildtype (wt), Gpr161mut1/mut1, and Wnt1-Cre; Gpr161f/f E12.5 head. Distances between nasal pits are shown as bidirectional arrows. Lateral and frontal views are shown. n=3–4 each. (B) RNA in situ hybridization for Ptch1 in E13.5 wildtype (wt), Gpr161mut1/mut1 head. Top panels, lateral view; middle panels, frontal tilted view shows palate and tongue; bottom panels, sagittal section showing tongue. Black dotted lines in the bottom panels indicate tongue. Bidirectional arrows show increased distance between nasal pits. Arrow points to prominent palatal shelf in Gpr161mut1/mut1. n=3 each. (C) RNA in situ hybridization for Gli1 in E12.5 wildtype (wt), Gpr161mut1/mut1 head. Top panels, frontal view. Middle panels show palates imaged from below (palatal view) and bottom panels show lower jaw viewed from above (tongue view) after separating the jaws. Arrows in upper panel show secondary palatal shelves. Black dotted lines in the bottom panels indicate tongue. Note increased gap between maxillary processes by ingression of median nasal processes. n=3 each. (D–E) Quantification of distance between nasal pits as shown in (A). The colors are matched with each strain in A and B. Error bars represent SEM. ***, p<0.001; ****, p<0.0001, unpaired t-test. n=3–4 each. (F) RNA in situ hybridization for Ptch1 in E12.5 control (Gli2-/+), Gpr161; Gli2 double ko and Gli2 ko head. Note persistent exencephaly in Gpr161; Gli2 double ko and midfacial widening. Displaced lower jaw is an artifact (*). n=1–2 each. Scale: (A and F), 1 mm; (B and C) 2 mm. Abbreviations: ex, exencephaly; mnp, medial nasal process; mx, maxillary process; mn, mandibular process; np, nasal pit; ps, palatal shelf; t, tongue.

