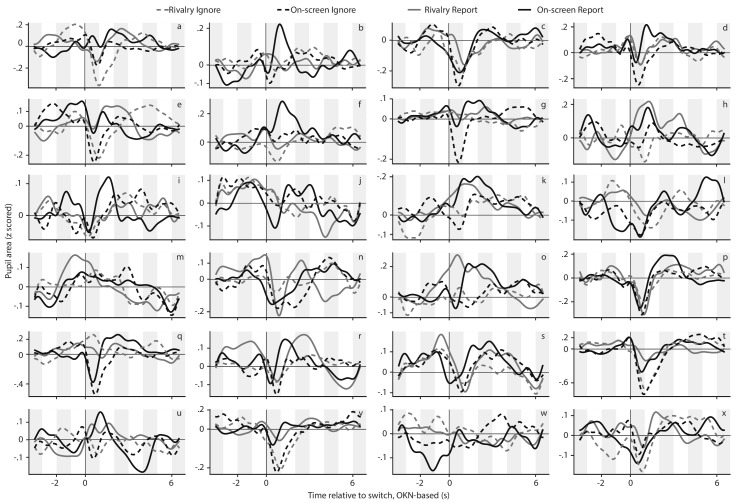
Appendix 1—figure 6. The per-observer pupil response curves that underlie the across-observer average curves of main text Figure 2A.
Each panel corresponds to one of the included observers, and the four curves within each panel correspond to the four conditions (see legend on top).

