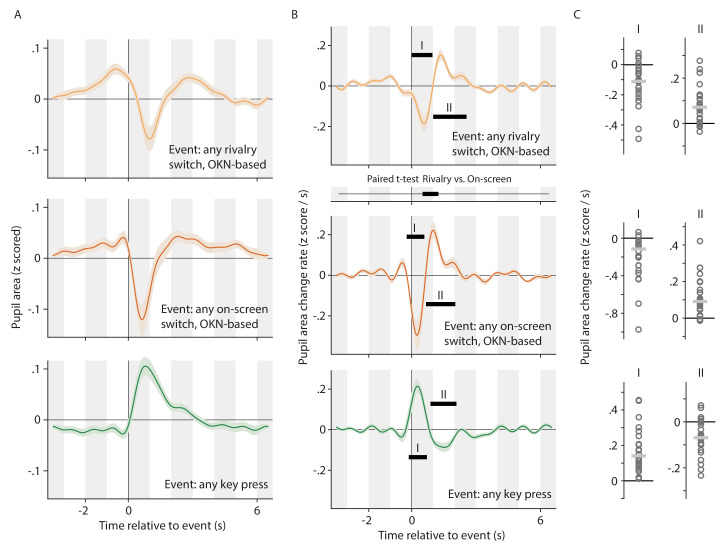
Figure 4. Alternative analysis of the data underlying Figure 2, now concatenating pupil signals across conditions, and regressing key press events and (rivalry or on-screen) switch events separately.
This allows the pupil response associated with switches to be teased apart from the pupil response associated with key presses, even in the data from the Report conditions where the two consistently overlap. All plotting conventions in panels A and B are as in Figure 2, but the time axis between the top and center plot of column B now shows the results of a paired t-test. All plotting conventions in panel C are as in Figure 3.

