. 2021 Aug 20;10:e64731. doi: 10.7554/eLife.64731

Figure 2. Dictyostelium single cells are attracted by an external O2 gradient when O2 level drops below 2%.

(A) Schemes of the new double-layer PDMS microfluidic device allowing the control of the O2 gradient by the separation distance (gap) between two gas channels located 0.5 mm above the three media channels and filled with pure nitrogen, and air (21% O2). (B) Measured O2 concentration profiles 30 min after N2-Air injection to the left and right channels respectively (0–21% gradient) as a function of the position along the media channel for the three gaps. Error bars (see Methods) are reported only for gap 1 mm for clarity. The inset shows the 0–2.5% region under the nitrogen gas channel (arrows, see E). (C) Trajectories lasting 1 hr between 3 hr and 4 hr after establishment of a 0–21% gradient. Cells are fast and directed toward the air side in the region beyond the −1000 µm limit (O2<2%). (D) Cell net displacement over 30 min (end to end distance, top kymograph) and 30 min displacement projected along gradient direction (bottom kymograph). Cells are fast and directed toward O2, where O2<2%, within 15 min after 0–21% gradient establishment at t=0. At t=180 min, the gradient is reversed to 21–0% by permuting gas entries. Cells within 15 min again respond in the 0–2% region. (E) Relative cell density histogram (normalized to t=0 cell density) as a function of the position along media channel. Top panel: long term cell depletion for positions beyond −1600 µm (O2<0.5%, see inset of B) and resulting accumulation at about −1200 µm for gap 1 mm channel. The overall relative cell density increase is due to cell divisions. Bottom panel: cell depletion and accumulation at 10 hr for the three gaps. The empty and filled arrows pointing the limit of the depletion region, and max cell accumulation respectively are reported in the inset of B.

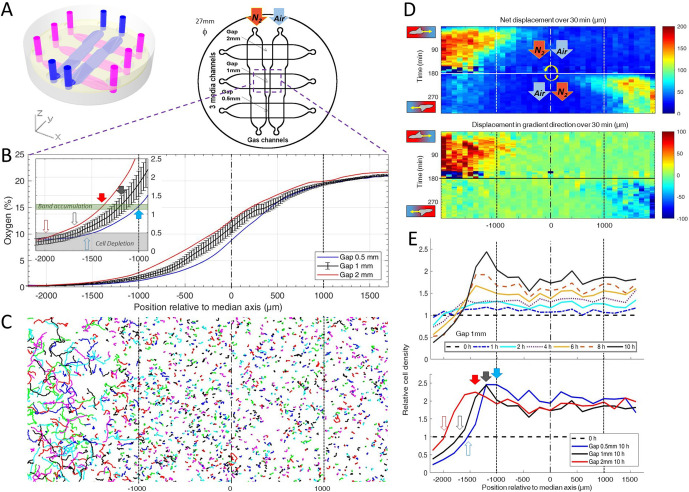
Figure 2—source data 1. Raw data for Figure 2.

Figure 2.

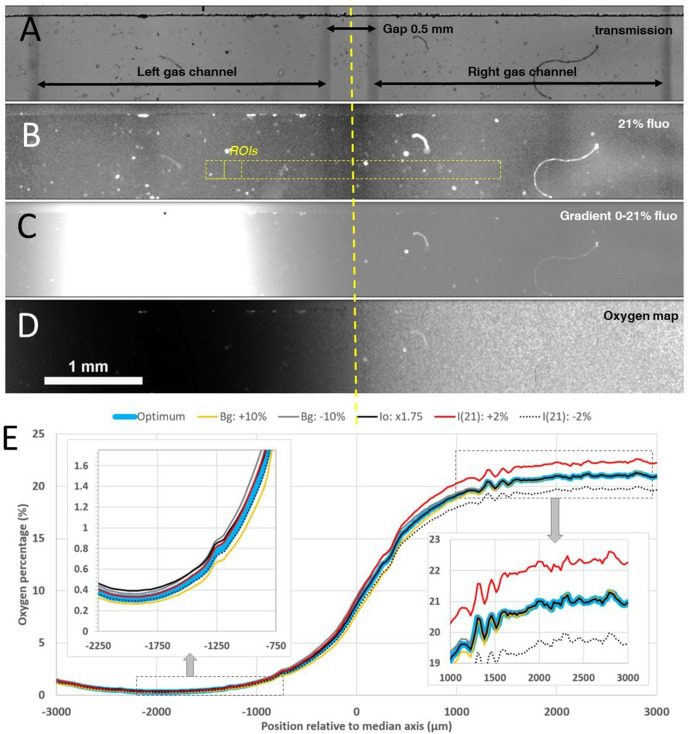
Figure 2—figure supplement 1. Oxygen profile measurements inside the microfluidic gradient generator device with a sensing film mounted on the bottom of the media channel.

Figure 2—figure supplement 1.

(A-B) Transmission and homogeneous 21% O2 level fluorescence images of the media channel with gap 0.5 mm between the two gas channels. (C) Raw fluorescence image in presence of 0–21% gradient established by injecting pure N2 in the left gas channel and air in the right one (image was taken 30 min after the beginning of the gas injection). (D-E) Corresponding calculated O2 map and O2 profile. In D colors correspond to slight changes within the experimental uncertainty of the parameters used for the calculation (see text), insets correspond to the hypoxic (~0%) and normoxic (~21%) sides of the profile.
Figure 2—figure supplement 1—source data 1. Raw data for Figure 2—figure supplement 1.
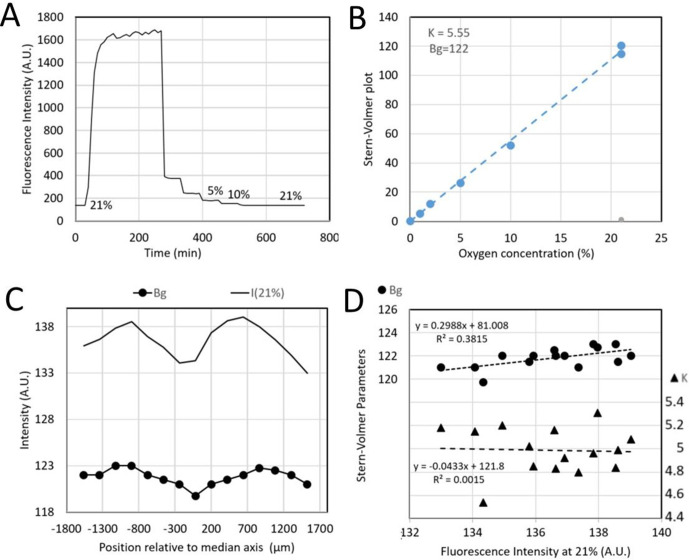
Figure 2—figure supplement 2. Typical calibration data of sensing films mounted on a microfluidic device.

Figure 2—figure supplement 2.

(A) Fluorescence intensity changes when applying an oxygen concentration ramp with the concentration in each gas channel. (B) Corresponding Stern-Volmer plot (see text). (C) Measured intensity at 21% O2 level (solid line) and fitted background Bg (bullets) for different ROI locations depicted in yellow in Figure 2—figure supplement 1B. (D) Fitted Bg (bullets) and Stern-Volmer sensitivity parameter K (triangles) as a function of 21% O2 level intensity.
Figure 2—figure supplement 2—source data 1. Raw data for Figure 2—figure supplement 2.
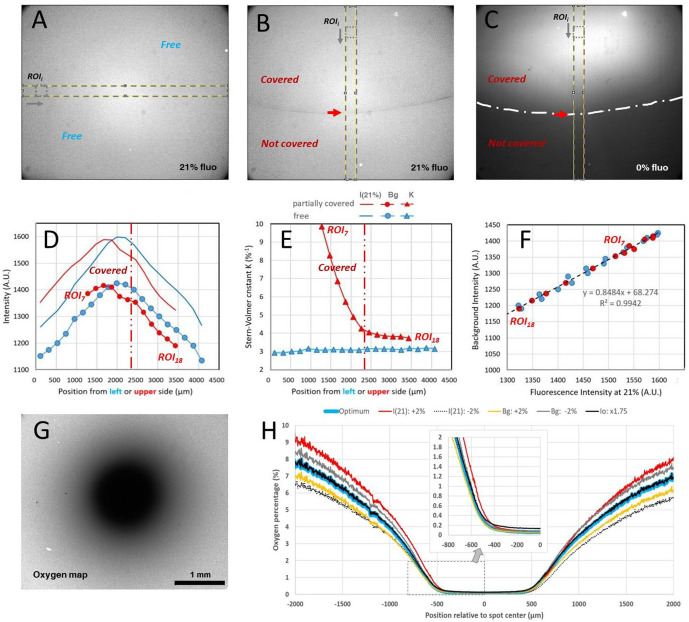
Figure 2—figure supplement 3. Typical calibration data and oxygen profile measurement with covered sensing films for the spot assay.

Figure 2—figure supplement 3.

(A) Homogeneous 21% O2 level fluorescence image of an uncovered sensing film. (B) Homogeneous 21% O2 level fluorescence image of sensing film partially covered by a plain coverglass simulating the border of the spot assay (the red arrow indicates the glass boundary also depicted as a long dotted line in C. (C) Fluorescence intensity when pure N2 was flushed for 80 min (same region as in B) with the partial coverage of the sensing film). (D) Measured intensity at 21% O2 level (solid line) and fitted background Bg (bullets) for different ROI positions depicted in yellow in A for uncovered film (blue color) and in B for partially covered film (red color). (E) Fitted Bg (bullets) and Stern-Volmer sensitivity parameter K (triangle) along the ROI positions for the uncovered (blue color) and partially covered situation (red color). (F) Fitted Bg plotted as a function of the 21% O2 level intensity for the uncovered and covered situations. (G-H) Calculated O2 map of a Dictyostelium spot covered and corresponding profile along a median horizontal line. Colors correspond to slight changes within the experimental uncertainty of the parameters used for the calculation, insets correspond to the hypoxic (~0–2%) left side of the profile.
Figure 2—figure supplement 3—source data 1. Raw data for Figure 2—figure supplement 3.
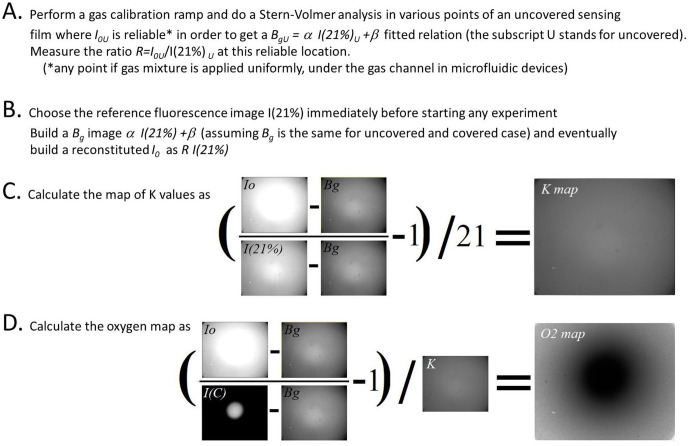
Figure 2—figure supplement 4. Image analysis pipeline to quantify oxygen map from O2 sensitive sensing films.

Figure 2—figure supplement 4.

Images correspond to an hypoxic circular zone created by a confined Dictyostelium spot.
Figure 2—figure supplement 5. Numerical simulations of oxygen profiles.

Figure 2—figure supplement 5.

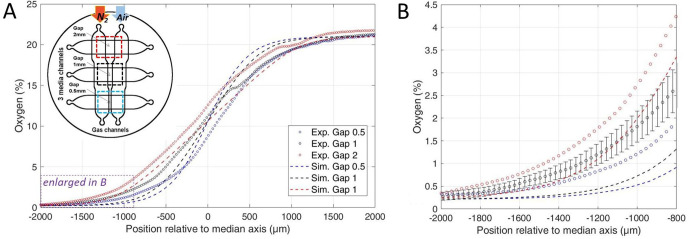
(A) Comparison of the measured stationary oxygen profile in the microfluidic device (circles) and simulated ones (dotted lines) for the three gaps. Oxygen is measured thanks to the sensing film. The inset shows the gas injection conditions in the device: pure N2 and air are flushed in left and right gas channel, respectively. (B) Enlarged oxygen profile in the hypoxic side. The estimated error bar on experimental measurements (showed for clarity on gap 1 mm data only) is explained in Materials and methods. Simulations are made with Comsol and explained in Methods.
Figure 2—figure supplement 5—source data 1. Raw data for Figure 2—figure supplement 5.
Figure 2—figure supplement 6. Experimental oxygen gradient establishment in the microfluidic device (gap 0.5 mm).

Figure 2—figure supplement 6.

Pure N2 and air are flushed at time 0 in left and right gas channel, respectively. (A) Oxygen profile measured using the sensing films at 5 min time interval. (B-C) Raw intensity and measured oxygen in the ROI between −1000 µm and −800 µm from the device median axis in the region where the oxygen is about 1.5% (dotted region in A). Within 15 min, each signal reached 95% of its equilibrium value.
Figure 2—figure supplement 6—source data 1. Raw data for Figure 2—figure supplement 6.
Figure 2—figure supplement 7. Influence of plated cells on the steady oxygen tension in the microfluidic device (Computational results).

Figure 2—figure supplement 7.

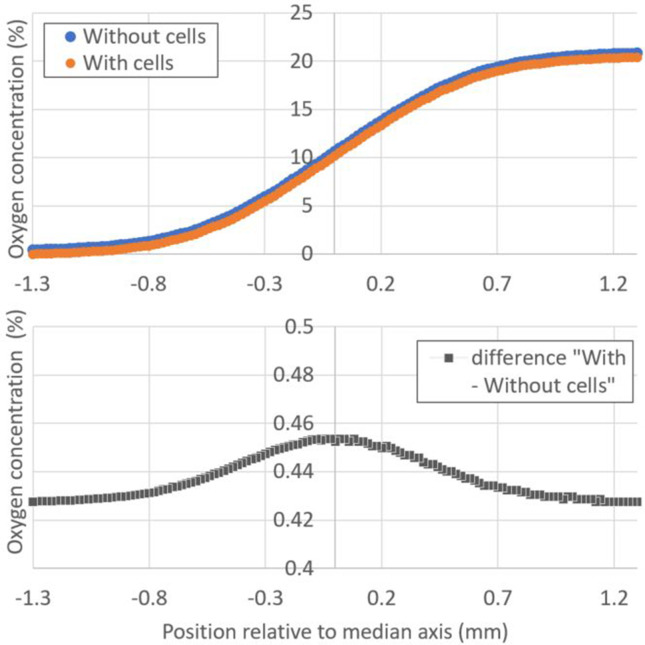
(A) Absolute value of the oxygen concentration as a function of the position relative to the median axis of the device for the gap 1 mm channel in presence (orange markers) or absence of cells (blue markers). Nitrogen is supplied on the left gas channel and 21% O2 is supplied on the right channel. Cells density was taken as 500 cells/mm2, which is the upper experimental limit. (B) Corresponding difference between the two simulated situations (presence and absence of cells). In the region of interest where cells exhibit a strong aerotactic response (i.e., around 1% O2 or −1 mm from the median axis), this difference is around 0.43% O2 which is comparable to the error bar on O2 measurements using sensing films (Figure 2B). The rate of oxygen consumption by Dd cells was taken as 1.2.10−16 mol.cell−1.s−1.
Figure 2—figure supplement 7—source data 1. Raw data for Figure 2—figure supplement 7.
Figure 2—figure supplement 8. Aerokinesis of Dd cells in homogenous environments.

Figure 2—figure supplement 8.

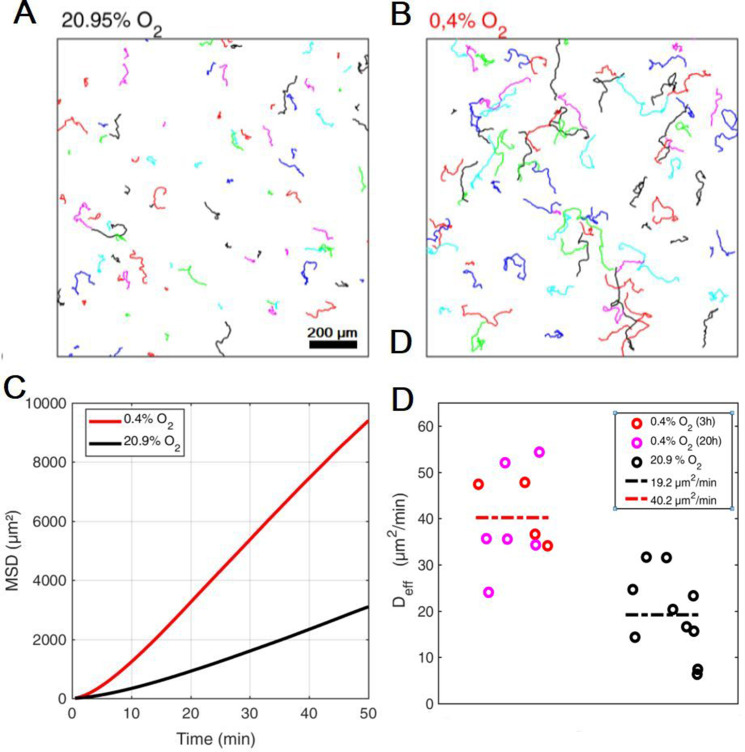
(A-B) Representative cell trajectories over 1 hr in either atmospheric, C=20.95% (A) or hypoxic, C=0.4% (B) conditions. (C) Quantification of cell motility as mean square displacements in both conditions. (D) Effective diffusion constants in both conditions, also shown after 3 and 20 hr in hypoxic conditions. Dashed lines represent the mean in each conditions over 10 fields of view stemming from five independent experiments in each case.
Figure 2—figure supplement 8—source data 1. Raw data for Figure 2—figure supplement 8.