. 2021 Aug 20;10:e64731. doi: 10.7554/eLife.64731

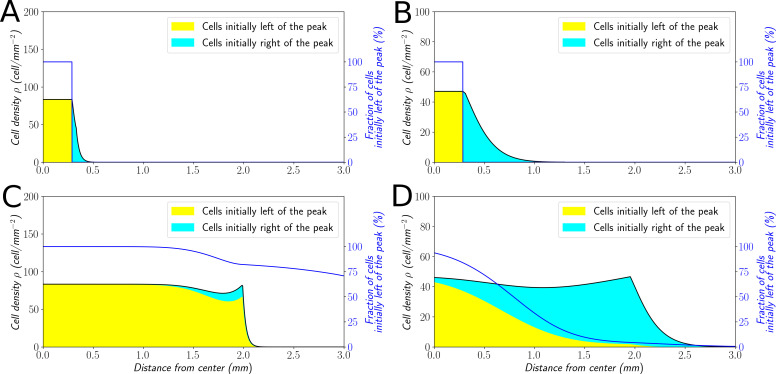
Figure 7. Classification of the expansion type in the ‘Go or Grow’ model.

Cells initially on the left-hand side or right-hand side of the peak get labeled differently (A and B). The labeling is neutral and does not change the dynamics of the cells. We let evolve the two colored population for some time and observe the mixing of the colors (C and D). (A and C) With a0=1µmmin-1, the wave is pushed wave and after some time the front undergoes a spatially uniform mixing. (B and D) With a0=0.1μmmin1, the wave is pulled and only the fraction initially in the front is conserved in the front. r0=ln2/480min-1 and C0=0.7% for all conditions.

Figure 7—source data 1. Zip file containing raw data for Figure 7 and associated Python code for simulations.

Figure 7.

Figure 7—figure supplement 1. Mixing in Potts models.
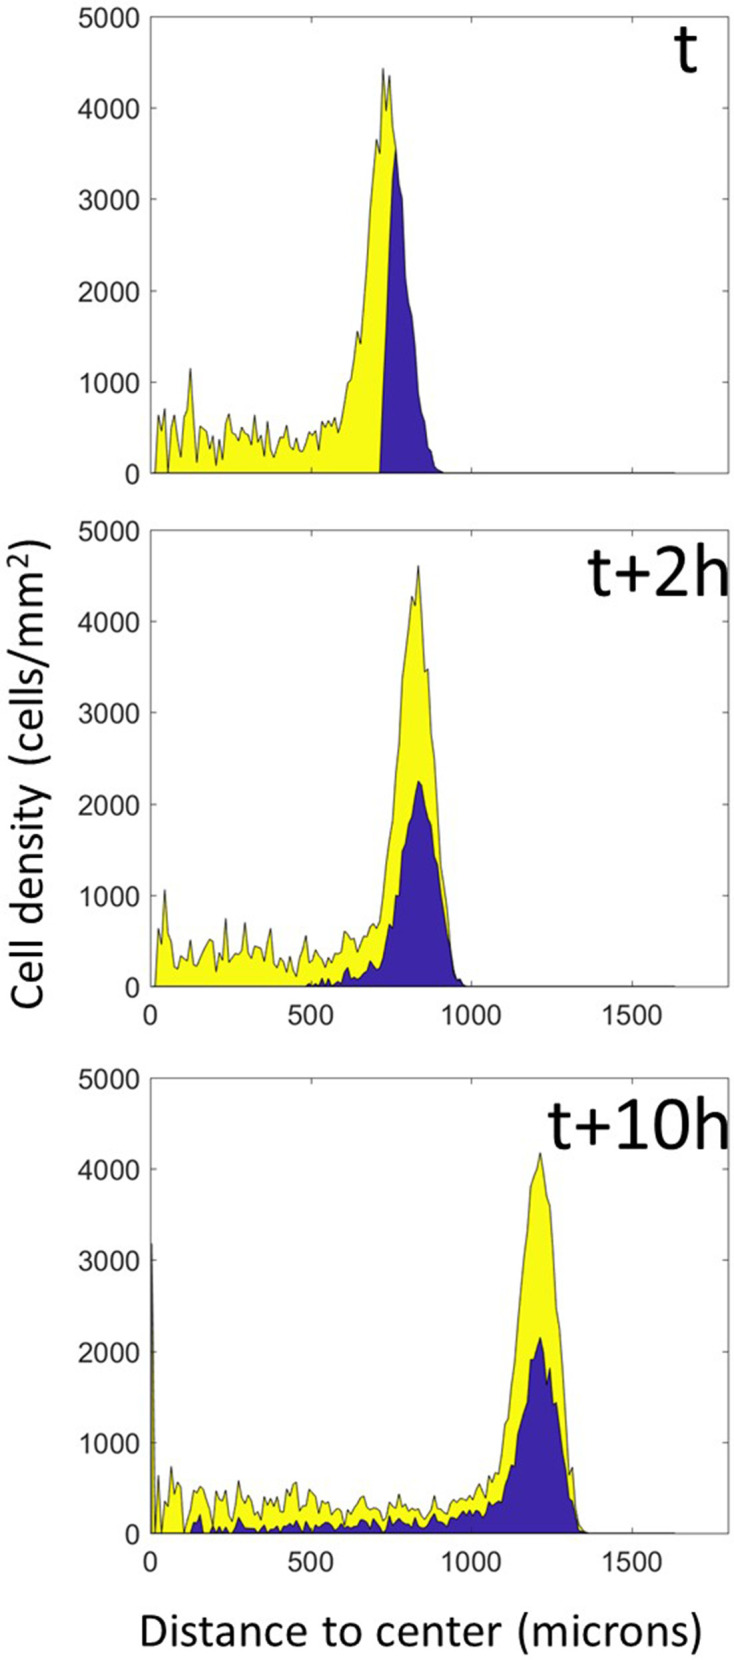
Figure 7—figure supplement 1.

A simulation of the full model was stopped at an arbitrary time and cells were colored according to their position at this time. The simulation was then restarted from this time point and left to run for the equivalent of 10 hr, at which point complete mixing of both populations is clearly visible.
Figure 7—figure supplement 1—source data 1. Raw data for Figure 7—figure supplement 1.
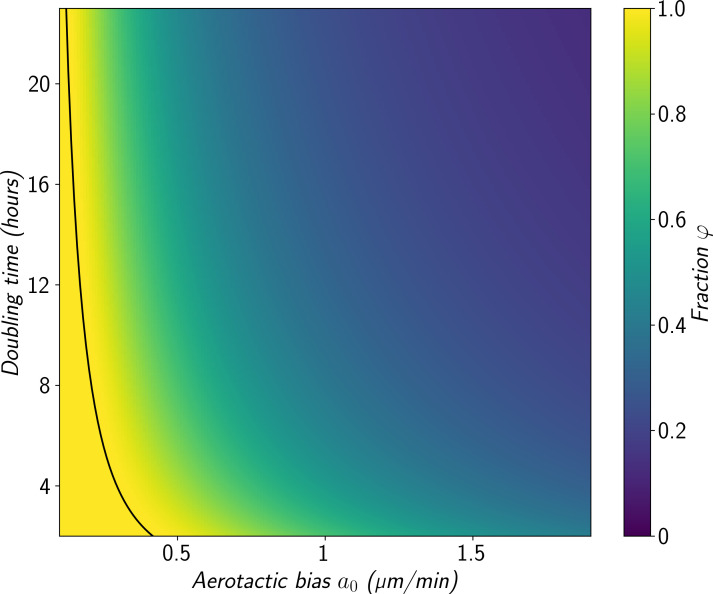
Figure 7—figure supplement 2. Heatmap of φ=2r0D/σ as a measure of the relative contribution of cell division to the overall wave speed σ in the space parameter 1/r0 and a0 for the ‘Go or Grow’ model with a second threshold, under the specific condition that O2 consumption term be bC=b0 and that O2 concentration may be negative (see Materials and methods).

Figure 7—figure supplement 2.

The curve a0=r0D is depicted in black.
Figure 7—figure supplement 2—source data 1. Zip file containing raw data for Figure 7—figure supplement 2 and associated Python code for simulations.
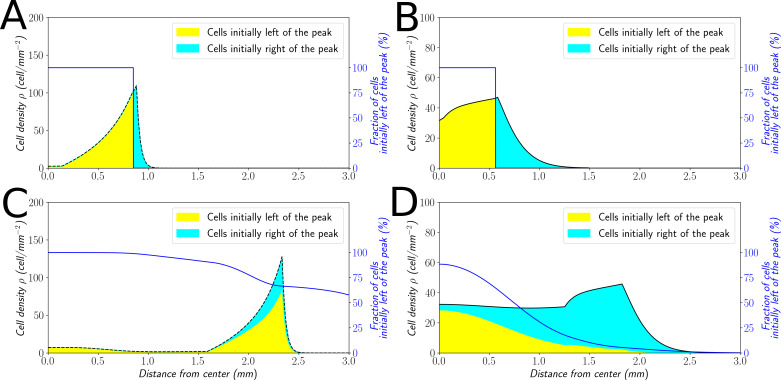
Figure 7—figure supplement 3. Classification of the expansion type in the ‘Go or Grow’ model with a second-threshold.

Figure 7—figure supplement 3.

Cells initially on the left-hand side or right-hand side of the peak get labeled differently (A and B). The labeling is neutral and does not change the dynamics of the cells. We let evolve the two colored population for some time and observe the mixing of the colors (C and D). (A and C) With a0=1µmmin-1, the wave is pushed and after some time the front undergoes a spatially uniform mixing. (B and D) With a0=0.1μmmin1, the wave is pulled and only the fraction initially in the front is conserved in the front.
Figure 7—figure supplement 3—source data 1. Zip file containing raw data for Figure 7—figure supplement 3 and associated Python code for simulations.