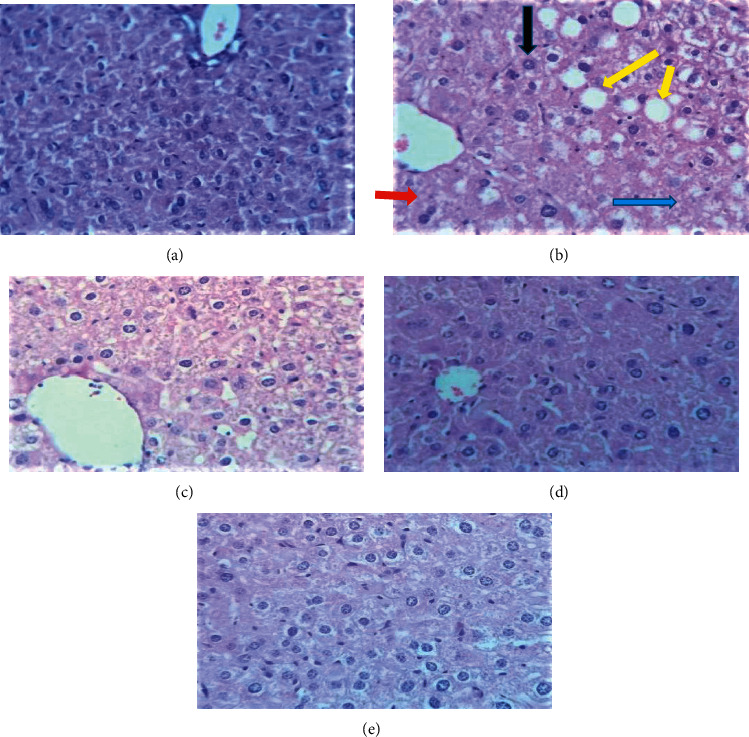
Figure 2.

Photomicrograph of the liver of experimental animals (stained with hematoxylin and eosin). Group I (a); group II (b); group III (c), group IV (d), and group V (e). Red arrow, hypertrophy; black arrow, vacuolar change; yellow arrow, fatty change, and blue arrow inflammatory infiltration.
