Figure 1.

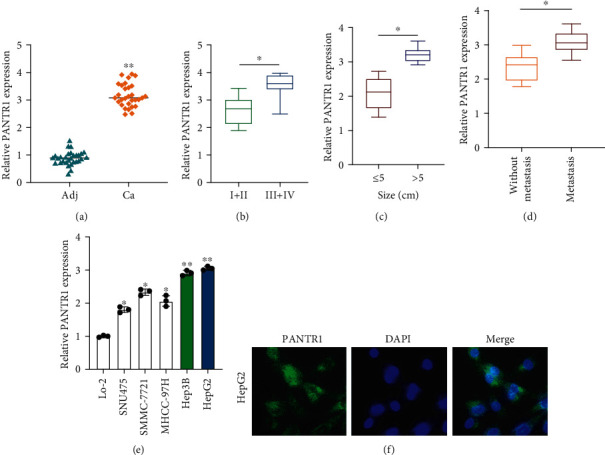
Expression of PANTR1 in HCC tissues and cells. (a) Relative expression of PANTR1 in HCC tissues was measured by qRT-PCR assay. (b) Expression level of PANTR1 in stage I-II and stage II-IV HCC tumors were assessed by qRT-PCR assay. (c) PANTR1 expression in different tumor sizes was measured by qRT-PCR. (d) PANTR1 expression in HCC tumors with or without metastasis status was measured by qRT-PCR, respectively. (e) The expression of PANTR1 in different HCC cell lines (SNU475, SMMC-7721, MHCC-97H, Hep3B, and HepG2) and normal liver cell LO-2 were detected by qRT-PCR. (f) FISH assay was conducted to determine the location of PANTR1 in HepG2 cells. Scale bar for FISH images: 10 μm. All assays were repeated three times. ∗P < 0.05 and ∗∗P < 0.01.
