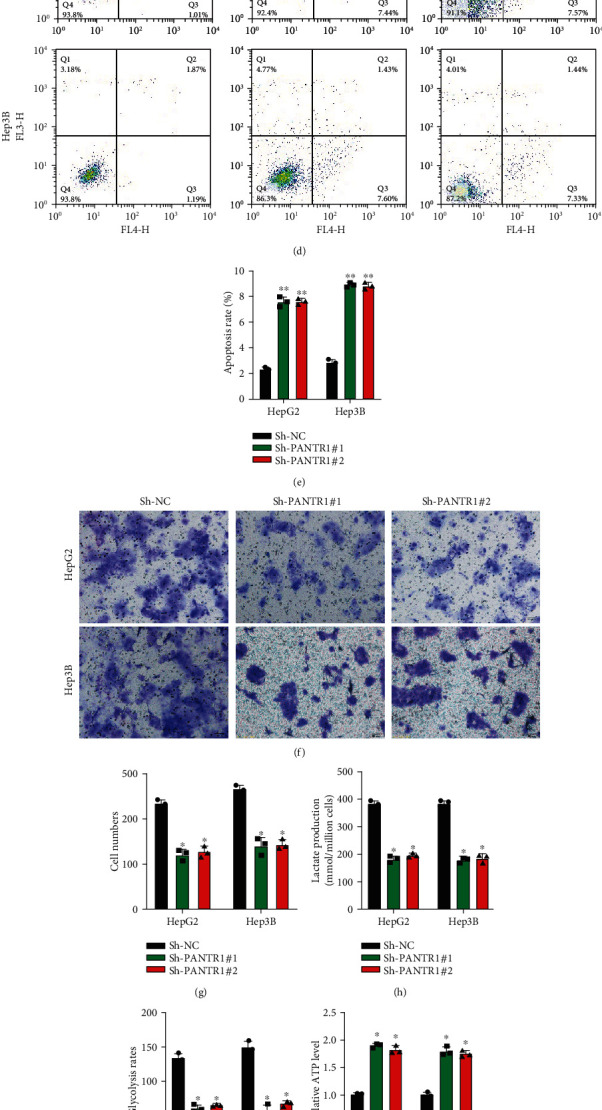
Figure 2.

Downregulation of PANTR1 inhibits cell functions in vitro and in vivo. (a) The transfection efficiencies of Sh-NC, Sh-PANTR1#1, and Sh-PANTR1#2 in HepG2 and Hep3B cells were detected by qRT-PCR. (b, c) The proliferation ability of HepG2 and Hep3b cells pretransfected with Sh-NC, Sh-PANTR1#1, and Sh-PANTR1#2 was assessed by CCK-8 assay. (d, e) The apoptosis rate of HepG2 and Hep3b cells pretransfected with Sh-NC, Sh-PANTR1#1, and Sh-PANTR1#2 was measured by flow cytometer assay. (f, g) HepG2 and Hep3b cells pretransfected with Sh-NC, Sh-PANTR1#1, and Sh-PANTR1#2 were subjected to Transwell migration assay for migration level detection. Comparative statistics are shown. Scale bars: 20 μm. (h–j) The Warburg effect phenomenon-related lactate production (h), glycolysis rates (i), and ATP levels (j) were detected as indicated. Data are shown as the mean ± standard deviation. All assays were repeated in triplicate. NOD/SCID mice (6 weeks old) were subcutaneously inoculated with HepG2 cells (1 × 10⁶ per tumor) pretransfected with Sh-NC or Sh-PANTR1#1. (k) Representative image of inoculated tumors. (l) Tumor end weights were recorded and analyzed. Comparative statistics are shown. (m) Tumor volumes on days 2, 4, 6, 8, 10, and 12 were recorded. Data are shown as the mean ± standard deviation (n = 3). ∗P < 0.05 and ∗∗P < 0.01.
