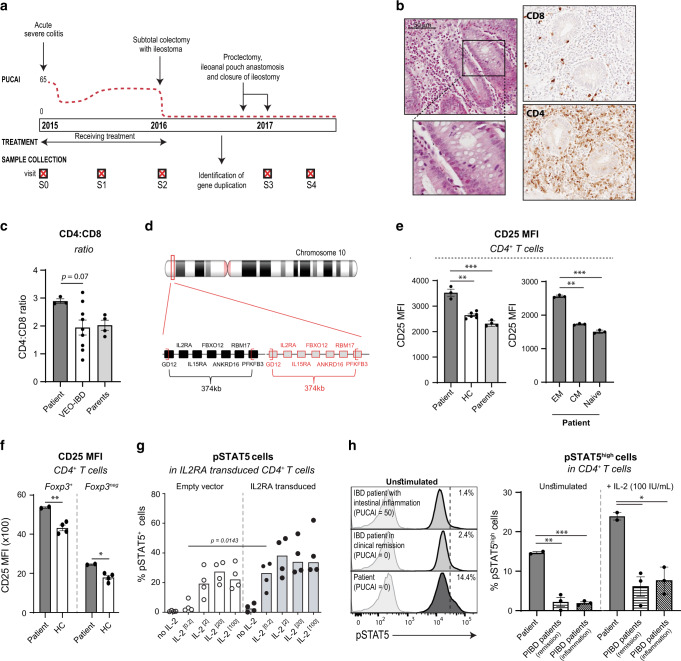
Fig. 1. A 374 kb duplication on 10p15.1 including the IL2RA locus leads to intrinsically increased CD25 and enhanced IL-2 signaling in CD4+ T cells.
a Timeline depicting the patient’s clinical course and time points of sample collection (denoted as visits S0-S4). PUCAI, pediatric ulcerative colitis activity index. b H&E staining on paraffin-embedded colonic tissue at the time of diagnosis (left, time point S0) and immunohistochemical detection of CD4 and CD8 in paraffin-embedded resected colonic tissue (right, time point S2). c Flow cytometric analysis of CD4:CD8 ratio in peripheral blood of the patient, her parents (time points S3 and S4), and VEO-IBD patients (n = 9). Median (5th to 95th percentiles) for the 2–5 year age category is 1.6 (0.9–2.9).23 d Localization of the patient’s duplication on chromosome 10. e–g Flow cytometric analysis of CD3, CD4, CD38, CD62L, CD45RA, CCR7, CD25, and/or Foxp3 expression was performed on peripheral blood from the patient, her parents (time points S3 and S4) and healthy adult controls (HC, n = 4–6). e CD25 expression (MFI) on total CD4+ T cells (left) and on effector memory (CD45RAnegCCR7neg), central memory (CD45RAnegCCR7+) and naive (CD45RA+CCR7+) CD4+ T cells in the patient (right). f CD25 expression on regulatory Foxp3+CD4+ T cells and Foxp3negCD4+ T cells. g Frequency of pSTAT5-positive cells among control primary T cells transduced with retrovirus particles carrying full-length IL2RA or an empty vector upon stimulation with increasing concentrations of IL-2 (0.2 to 100IU/mL) (n = 4, p = 0.0143 at 0.2 IU/mL was calculated using Wilcoxon-Mann Whitney test). h PBMCs of the patient, PIBD patients with active intestinal inflammation (n = 3), and PIBD patients in remission (n = 3) were stimulated with IL-2 (100 IU/mL) for 15 min followed by quantification of STAT5 phosphorylation (pY694) in CD4+ cells by flow cytometry (visit S3). n.s., not significant, *p < 0.05, **p < 0.01, ***p < 0.001 using one-way ANOVA followed by the Bonferroni’s Multiple Comparison Test.

