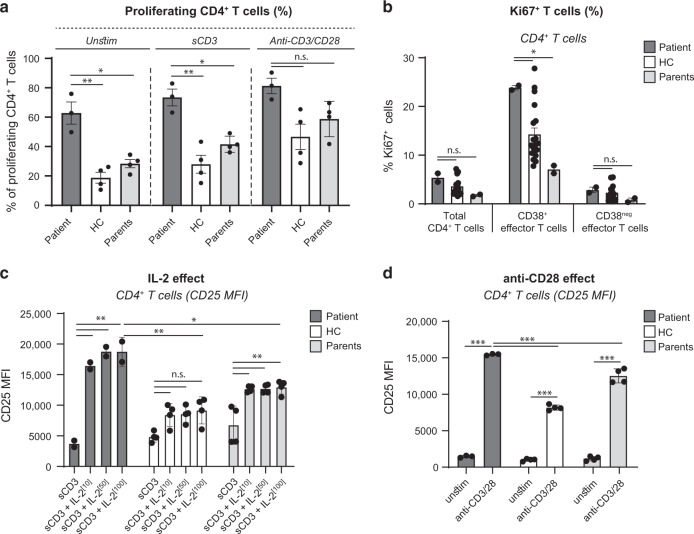
Fig. 2. CD25 overexpression is associated with increased response to IL-2.
a Patient PBMCs (visits S3 and S4) and healthy adult control (n = 4) were stimulated with anti-CD3 (500 ng/ml) or anti-CD3/CD28 beads (bead-to-cell ratio 1:2) for 48 h. The percentage of proliferating CD4+ T cells was analyzed by CellTrace Violet dilution. b Frequencies of Ki67+ cells gated on CD4+ T cells, CD62LnegCD38+CD4+ T cells and CD62LnegCD38negCD4+ T cells. Data are mean ± SEM (healthy adult controls, n = 19). c PBMCs were stimulated with anti-CD3 (500 ng/ml) in the absence or presence of IL-2 (10, 50, or 100 IU/ml). After 48 h, CD3, CD4, and CD25 expression were determined by flow cytometry. d PBMCs were stimulated with anti-CD3/CD28 beads (bead-to-cell ratio 1:2). CD25 expression on CD4+ T cells was analyzed at 48 h. Data are mean ± SEM (n = 4). Representative of two independent experiments (time points S3 and S4); n.s., not significant, *p < 0.05, **p < 0.01, ***p < 0.001 using one-way ANOVA followed by the Bonferroni’s Multiple Comparison Test.

