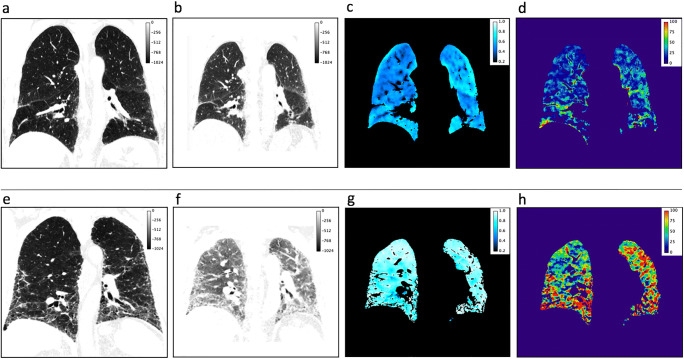
Fig. 6.
Baseline scans of a patient with stable disease (upper row, a–d) and a patient with progressive disease (lower row, e–h). The images are presented in the following order: CT in inspiration, CT in expiration, regional ventilation, and late enhancement. Stable patient mean regional ventilation 0.51; mean late enhancement 24%; baseline/follow-up values FVC% 73%/85%; lung volume 4269 mL/ 4549 mL; mean lung density - 812 HU/-827 HU. Progressing patient mean regional ventilation 0.76; mean late enhancement 52%; baseline/follow-up values FVC% 79%/57%; lung volume 3823 mL/ 3058 mL; mean lung density - 749 HU/− 677 HU. The patient in the upper row showed a low disease activity, as indicated in the regional ventilation and late enhancement images. FVC% and the mean lung volume and density values even improved with antifibrotic therapy. The patient in the lower row presented much higher ventilation and late enhancement values in the baseline scan, resulting in disease progression in the follow-up’s reference parameters

