Fig. 2.

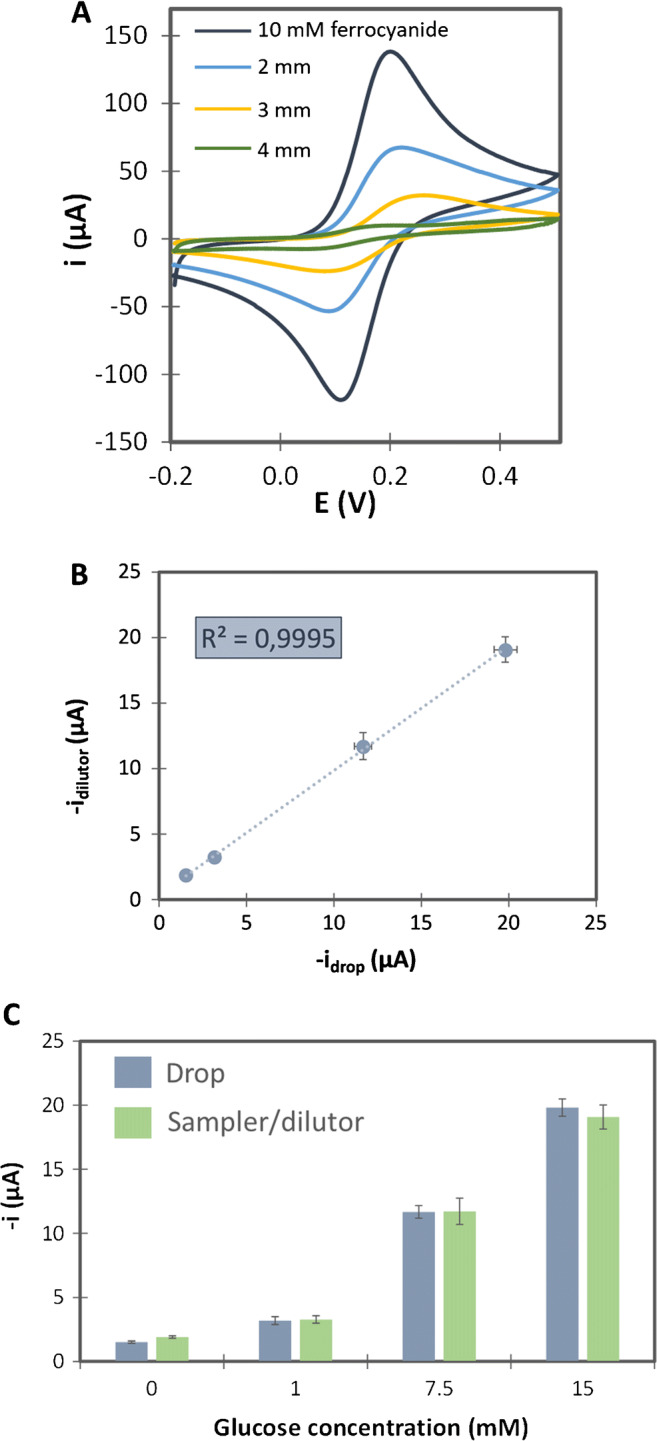
A) CVs obtained using different widths (2, 3 and 4 mm) of the dilution strip (design 1) immersed in buffer solution. The sample strip was always immersed in a 10 mM ferrocyanide solution. Signals were compared with this obtained from a CV recorded when a drop of 10 mM of ferrocyanide was directly deposited on the WE. CVs were recorded at a scan rate of 50 mV·s−1. B) Comparison of current intensities obtained for glucose concentrations after depositing drops directly on the electrochemical cell and after dilution of 20-times-higher glucose concentrations, measured with the developed platform (design 2). C) Bar diagram of the current intensities obtained for glucose concentrations after depositing drops directly on the electrochemical cell (blue bars) and for 20-times-higher glucose concentrations measured after dilution with the developed platform (green bars). Chronoamperograms were recorded applying −0.1 V (vs. gold-plated wire) during 50 s. Data are given as average ± SD (n=5)
