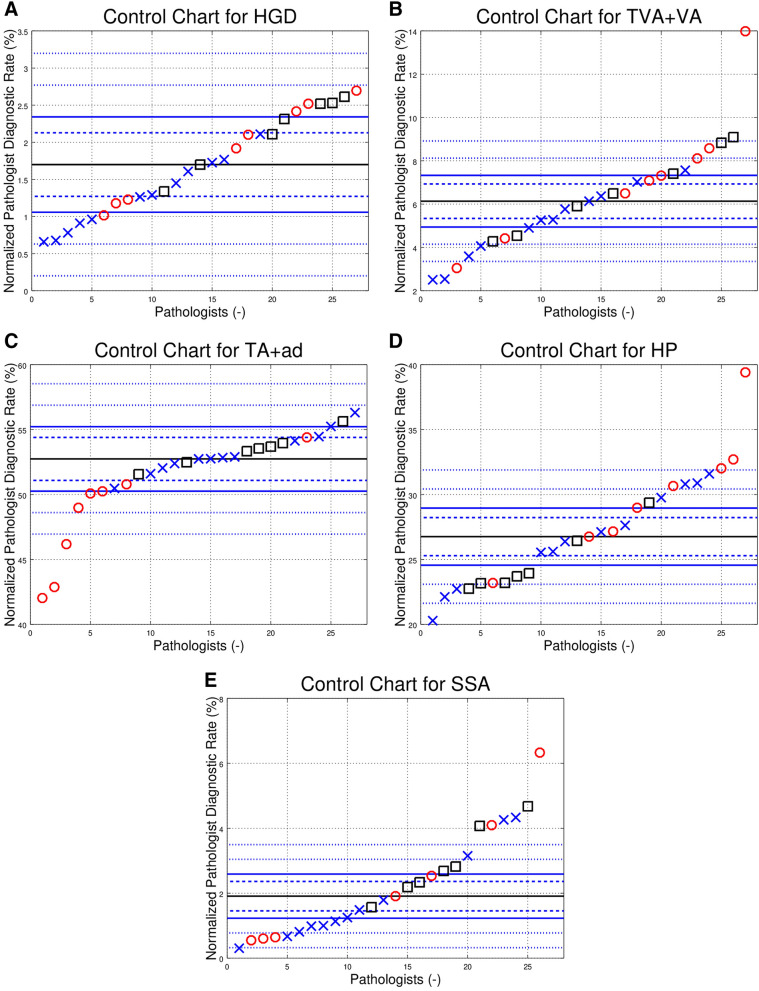
Figure 2.
Control charts showing the normalized pathologist diagnostic rates (PDRs) for the 27 pathologists reading > 600 CRPS in the seven year study period. Each panel (control chart) in this figure is one diagnosis, e.g. SSA. The different markers (red circles, blue Xs, black boxes) represent individual pathologists from different hospitals. The solid black line is the group median diagnostic rate (GMDR). The dashed blue control lines above and below the GMDR are 2 standard deviations (SDs) from the GDMR; pathologists outside the inner funnel are statistically different than the GMDR (p < 0.05). The solid blue control lines above and below the GMDR represent 3 SDs; pathologist outside the outer funnel are statistically different than the GMDR (p < 0.003). The outer finely dashed blue control lines above/below the GMDR are 5 SDs and 7 SDs from the GMDR respectively; points above/below the lines are p < 6e−7 and p < 3e−12 respectively. Controls lines may be absent if the GMDR is close to zero (as negative normalized PDRs do not have a physical interpretation). The individual panels (control charts) are (A) normalized high-grade dysplasia (HGD) PDRs; (B) normalized tubulovillous adenoma + villous adenoma (TVA + VA) PDRs; (C) normalized tubular adenoma and adenoma not otherwise specified (TA_ad) PDRs; (D) normalized hyperplastic polyp (HP) PDRs; (E) normalized sessile serrated adenoma (SSA) PDRs, only the 26 of the 27 pathologists shown; one pathologist had a normed diagnostic rate > 25% (not shown).

