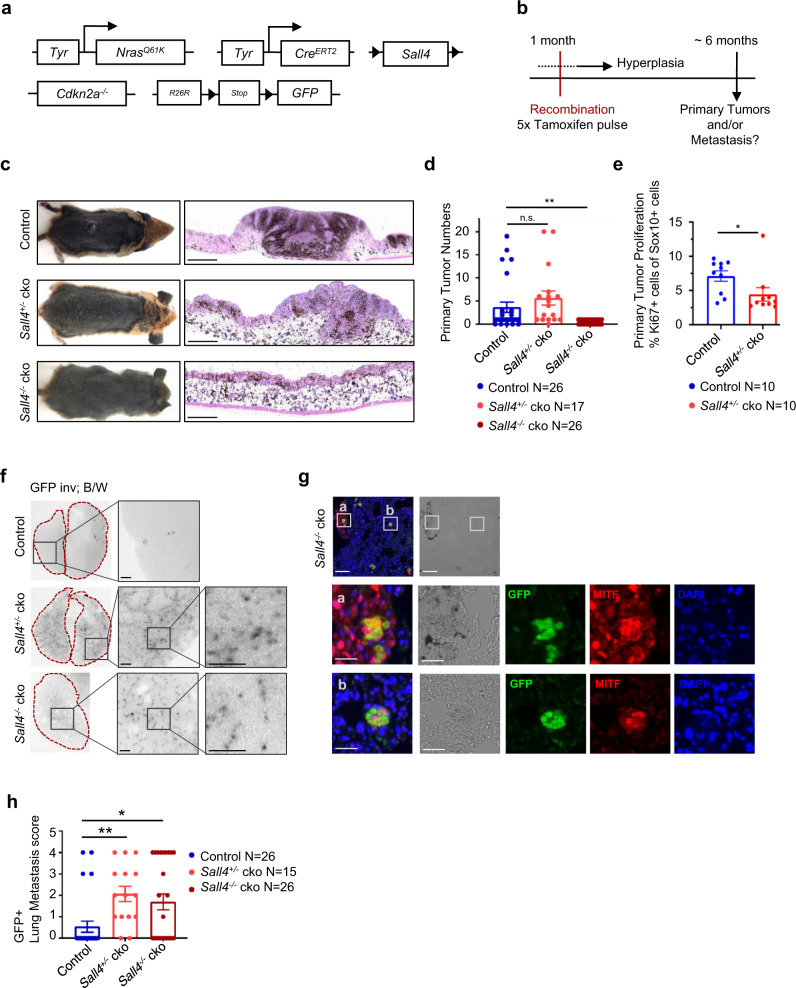
Fig. 2. Sall4 is essential for primary tumor formation, but its depletion leads to increased micrometastasis.
a Genetics scheme of the Tyr::NrasQ61K; Cdkn2a−/− transgenic mouse model spontaneously developing melanoma, which was crossed with inducible Tyr:CreERT2; Sall4lox/lox; R26R-LSL-GFP mice, allowing ablation of Sall4 from the melanocytic lineage upon tamoxifen administration. b Experimental scheme depicting how at 1 month of age the experimental mice from a undergo Cre-mediated recombination due to 5 consecutive i.p. tamoxifen injections. Hyperplasia gradually develops from birth of the pups. Primary tumors and metastasis were assessed at around 6 months of age. c Photographs of control and heterozygous (Sall4lox/wt; termed Sall4+/− cko) and homozygous (Sall4lox/lox; termed Sall4−/− cko) Sall4 cko animals (left panel). Hematoxylin and eosin staining of back skin from respective control, Sall4+/− cko or Sall4−/− cko animals (right panel), which has been repeated in independent experiments with similar results 7 times. Scale bars 500 µm. d Quantification of primary tumor numbers of control (Sall4+/+ and non-tamoxifen-injected animals), Sall4+/− cko and Sall4−/− cko animals. e Quantification of proliferation rate, assessed by immunohistochemistry (see Supplementary Fig. 3c), in primary tumors of control and Sall4+/− cko animals. f Binocular images of mouse lungs. The endogenous fluorescent GFP signal was imaged under a fluorescent binocular and for visualization inverted and set to black/white (B/W). Dark spots therefore represent inverted GFP+ spots set to B/W. Scale bars 500 µm. g Immunohistochemical stainings of mouse lung sections to verify melanoma identity of GFP+ spots by means of MITF expression. Scale bars top panel 100 µm, second and third panel 25 µm. h Quantification of GFP+ lung metastases of tamoxifen-injected control (Sall4+/+), Sall4+/− cko, and Sall4−/− cko animals. Metastasis score = 0 indicates <5 GFP+ lesions, 1 >5 lesions, 2 >20 lesions, 3 >50 lesions, 4 >100 lesions. In d, e, h, error bars represent mean ± SEM with N indicated in the respective figures. Two-sided t-tests between groups were performed for significance with p values ≥0.05 = n.s.; <0.05 = *; <0.01 = **, with Sall4−/− cko in d P = 0.0049; Sall4+/− cko in e P = 0.0456; Sall4+/− cko in h P = 0.0011; Sall4−/− cko in h P = 0.0129. Source data for d, e, h are provided as a Source Data file.

