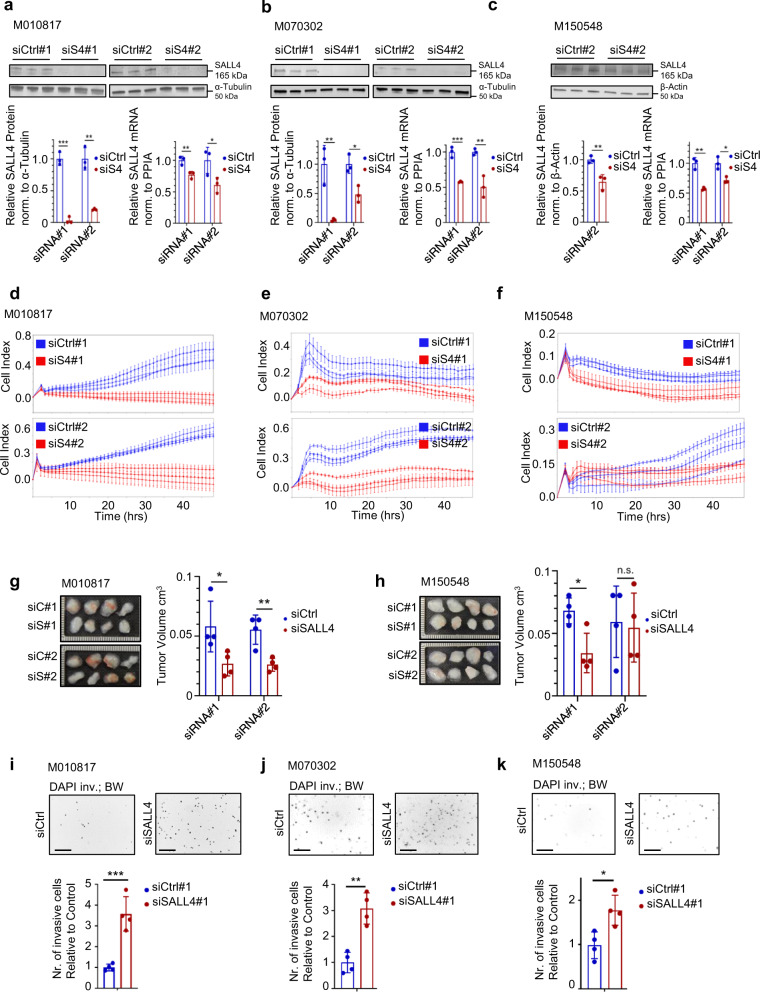
Fig. 3. SALL4 knockdown leads to reduced proliferation and increased invasion.
a–c SALL4 expression after 48 h knockdown with two different siRNAs assessed by western blot (top panel and bottom panel left (quantification)) and qRT-PCR (bottom panel right) on the same samples. Experiments performed in human melanoma cells with different mutational backgrounds: M010817 (NRASQ61K), M070302 (unknown mutational status), M150548 (BRAFV600E). siS4: siSALL4. d–f xCELLigence real-time analysis of cell proliferation (Cell Index) of M010817, M070302, and M150548 cells after 48 h siRNA-mediated SALL4 knockdown as in a–c. Three samples per experimental group were analyzed, each consisting of four technical replicas (proliferation wells analyzed by xCELLigence). g–h In vivo xenografts after SALL4 knockdown: 24 h after siRNA treatment in vitro, cells were grafted subcutaneously onto nude mice and let grown for 6 days, when images were taken and tumor sizes of M010817 and M150548-derived grafts were quantified. Scale units = 1 mm. i–k Corning Transwell® invasion assay: siControl or siSALL4-treated cells (48 h) were seeded onto the porous, matrigel-covered membrane of an invasion chamber insert and let to migrate from FCS-free (top chamber) to FCS high (lower chamber) medium. Numbers of invaded cells on the bottom side of the invasion membrane were analyzed after 24 h. Invaded cells were stained with DAPI, imaged and set to black and white (top panels) for quantification (bottom panels). Scale bars 200 µm. Error bars represent mean ± SD and for significance, two-sided t-tests were performed with N = 3 (a–f) and N = 4 (g–k) and p values ≥0.05 = n.s.; <0.05 = *; <0.01 = ** and <0.001 = *** with siRNA#1 in a (lower left panel) P = 0.0001; siRNA#2 in a (lower left panel) P = 0.0015; siRNA#1 in a (lower right panel) P = 0.0099; siRNA#2 in a (lower right panel) P = 0.0476; siRNA#1 in b (lower left panel) P = 0.0070; siRNA#2 in b (lower left panel) P = 0.0133; siRNA#1 in b (lower right panel) P = 0.0006; siRNA#2 in b (lower right panel) P = 0.0058; siRNA#2 in c (lower left panel) P = 0.0094; siRNA#1 in c (lower right panel) P = 0.0016; siRNA#2 in c (lower right panel) P = 0.0129; siRNA#1 in g P = 0.0372; siRNA#2 in g P = 0.0047; siRNA#1 in h P = 0.0117; P in i = 0.0009; P in j = 0.0012; P in k = 0.0129. Source data for all panels are provided as a Source Data file.

