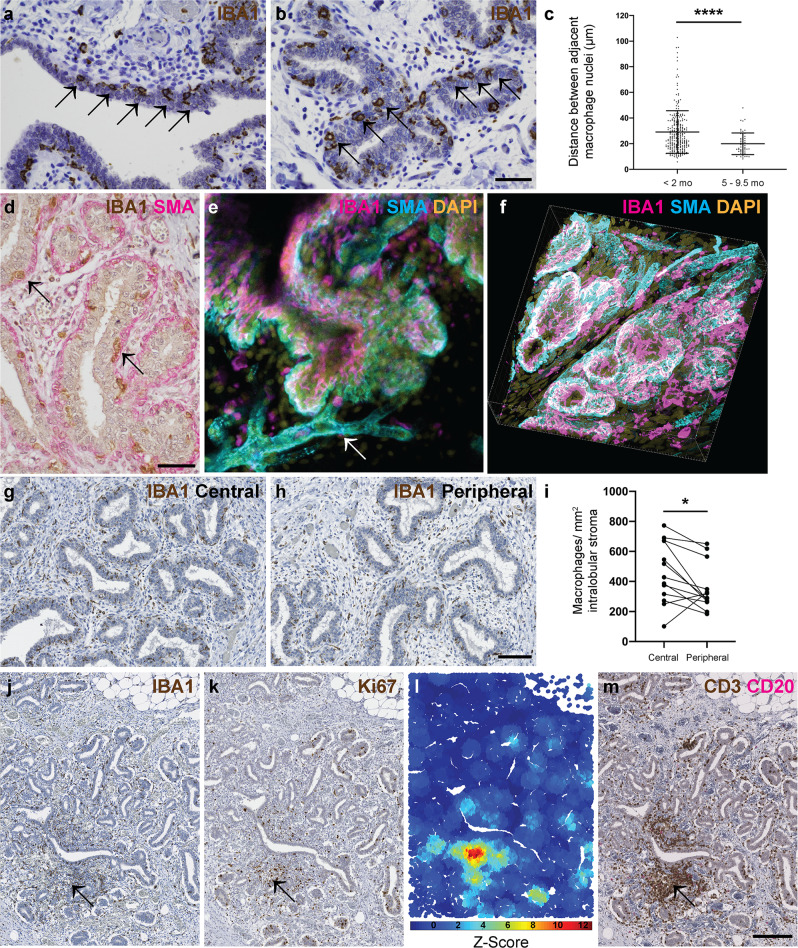
Fig. 4. Mammary macrophages exhibit spatial and temporal dynamics.
a, b IHC for IBA1 reveals macrophage periodicity (arrows) in ducts (a) and ductules (b). c Scatter plot demonstrating that the distributions of inter-macrophage distance differ significantly between lambs aged <2 mo and 5–9.5 mo. Dots represent inter-macrophage distances from 13 individual lambs. Bars represent mean ± standard deviation. **** p < 0.0001. d IHC for IBA1 (brown) and alpha smooth muscle actin (SMA; pink). Arrows indicate macrophages. e, f 3D confocal microscopy of optically cleared ovine mammary tissue with IF for IBA1 (magenta) SMA (cyan) and DNA (DAPI; gold). Images represent 3D maximum intensity projections. Arrow indicates blood vessel. g, h IHC for IBA1 in central (g) and peripheral (h) foci. i Scatter plot demonstrating significantly reduced macrophage abundance in peripheral compared to central foci. Dots represent average macrophage density for individual lambs. * p < 0.05. j–m Serial sections demonstrating IHC for IBA1 (j) Ki67 (k) and CD3 (brown) and CD20 (pink) (m) with accompanying G-O plot for Ki67 (l) (scale (d) parameter = 250 px). Arrow indicates co-localisation of stromal macrophages, a Ki67 hotspot, and a CD3+ lymphocyte aggregate. Images are representative of 13 (a, b, g, h), and three (d–f, j–m) biological repeats; mo, months old. All IHC images have haematoxylin counterstain. Scale bar = 40 μm (a, b, d); 100 μm (g, h); 200 μm (j, k, m).

