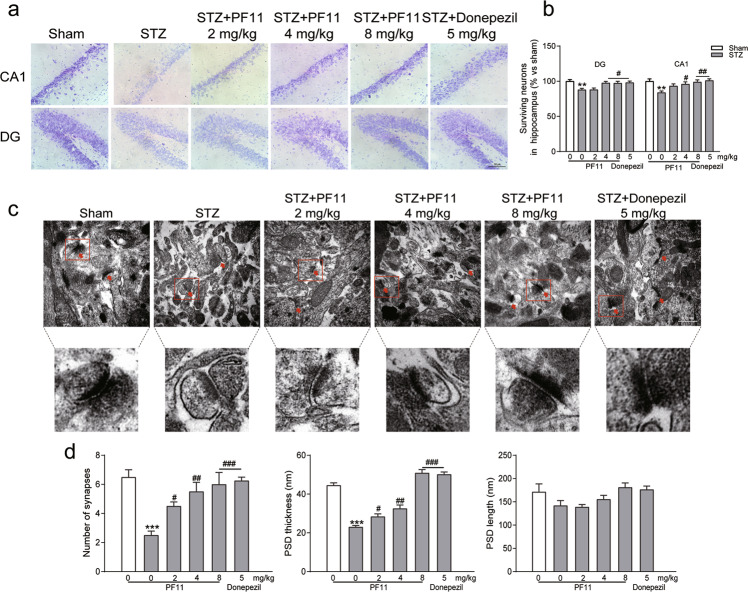
Fig. 3. PF11 alleviated STZ-induced neuronal death and synaptic damage.
a Nissl staining (×40, ×400) was used to evaluate neuronal death in the hippocampal DG and CA1 regions. Sections of the hippocampal DG and CA1 regions (scale bar = 50 μm). b Quantitative analysis of the number of surviving neurons in the hippocampal DG and CA1 regions with Image-Pro Plus (Media Cybernetics, Inc., Rockville, MD, USA) (n = 9). c Transmission electron microscopy (TEM) (×900) was performed to observed synapse structure (scale bar = 500 nm). The red arrow indicates a synapse. d Quantitative analysis of the number of synapses, PSD thickness and PSD length (n = 3). The data are reported as the mean ± SEM. **P < 0.01, ***P < 0.001 vs. sham rats; #P < 0.05, ##P < 0.01 vs. the STZ group.

