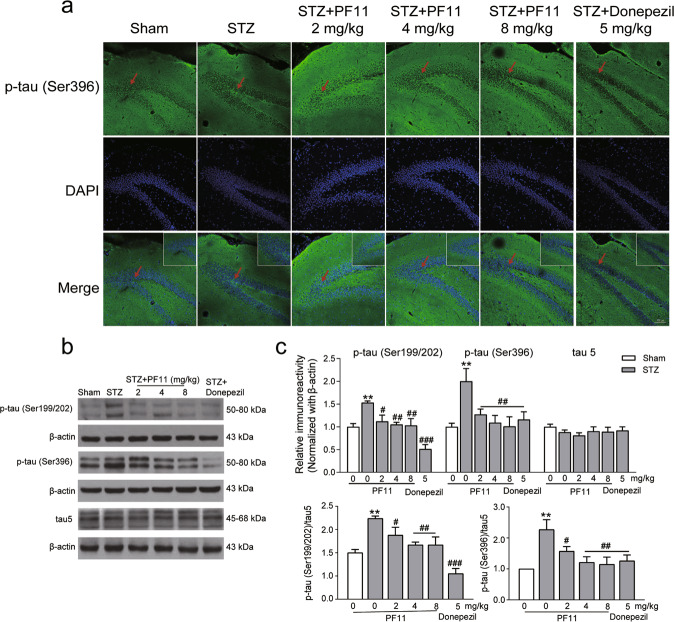
Fig. 4. PF11 inhibited STZ-induced tau hyperphosphorylation in the hippocampus.
a Representative figures of coronal sections from each group after immunofluorescence staining against p-tau (scale bar = 100 μm, the red arrow indicates positive staining). b Levels of p-tau in the hippocampus were measured by Western blotting. c The integral optical density of p-tau (Ser396), p-tau (Ser199/202), and Tau5 in the hippocampus analyzed with ImageJ (NIH Image, Bethesda, MD, USA). The data are reported as the mean ± SEM (n = 3). **P < 0.01 vs. the sham group; #P < 0.05, ##P < 0.01, and ###P < 0.001 vs. the STZ group.

