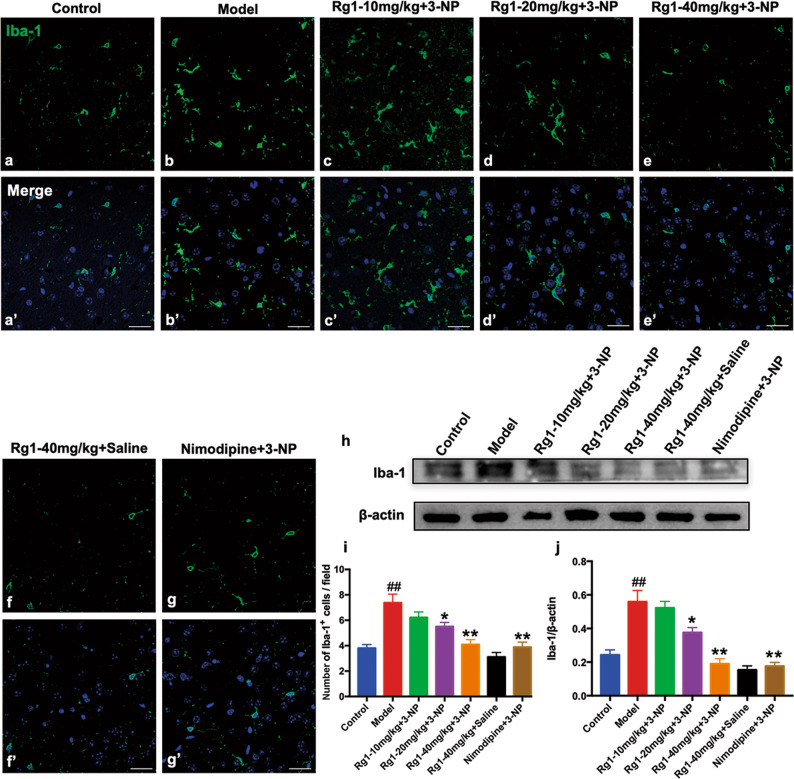
Fig. 6. Rg1 inhibited the striatal microglial activation induced by 3-NP.
a–g, a’–g’ The representative photomicrographs of immunofluorescence histochemical staining of Iba-1 in the striatum. i Quantitative analysis of Iba-1-positive cells in the striatum. h, j The representative blots and densitometry data for Iba-1 in the striatum across groups. Data are expressed as the mean ± SEM, n = 3. ##P < 0.01 vs control group; *P < 0.05, **P < 0.01 vs model group. Scale bars, (a–g, a’–g’) 25 μm.

