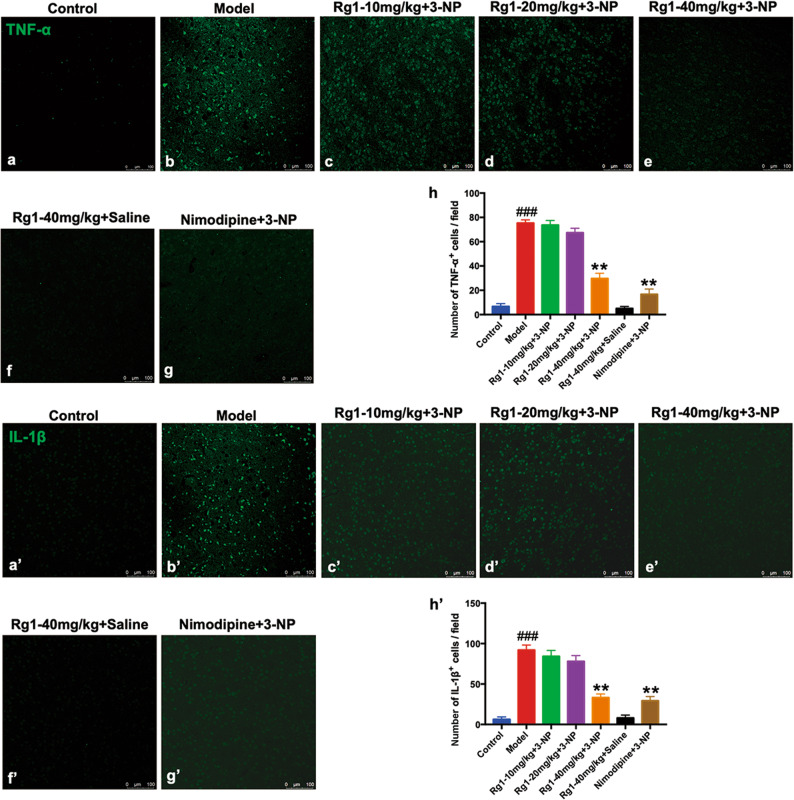
Fig. 7. Rg1 decreased the productions of proinflammatory cytokines induced by 3-NP.
a–g, a’–g’ The representative photomicrographs of IHC staining for TNF-α and IL-1β in the striatum across groups. h, h’ Quantitative analysis of TNF-α- and IL-1β-positive cells in the striatum across groups. Data are expressed as the mean ± SEM, n = 3. ###P < 0.001 vs control group; **P < 0.01 vs model group. Scale bars, (a–g, a’–g’) 100 μm.

