
Figure 3.
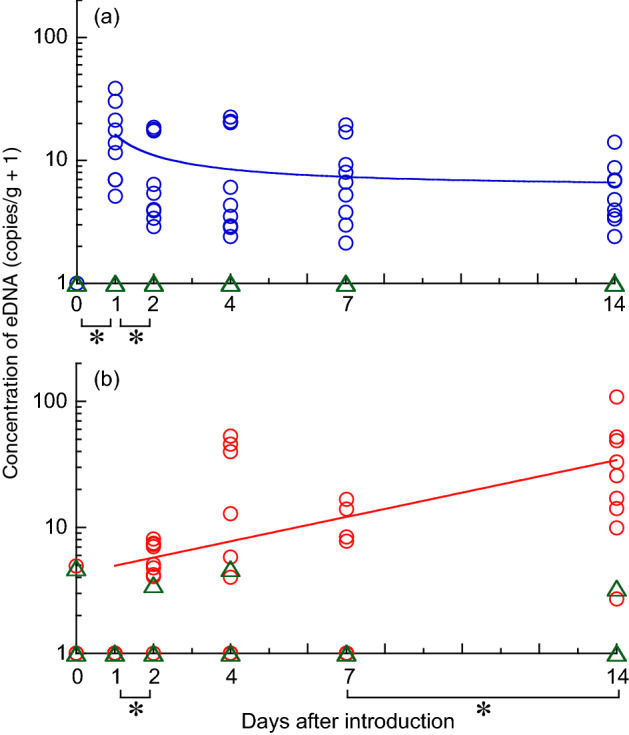
Concentration of eDNA in (a) tank water and (b) sediment after the introduction of fish. Nine samples (triplicates from each of three tanks, indicated by circles) for test groups and three samples (triplicates from one tank, triangles) for control were analyzed and plotted. Asterisks indicate significant differences between two consecutive sampling days (p < 0.05, Tukey’s HSD test). The best models shown in Supplementary Table S3 were fitted.