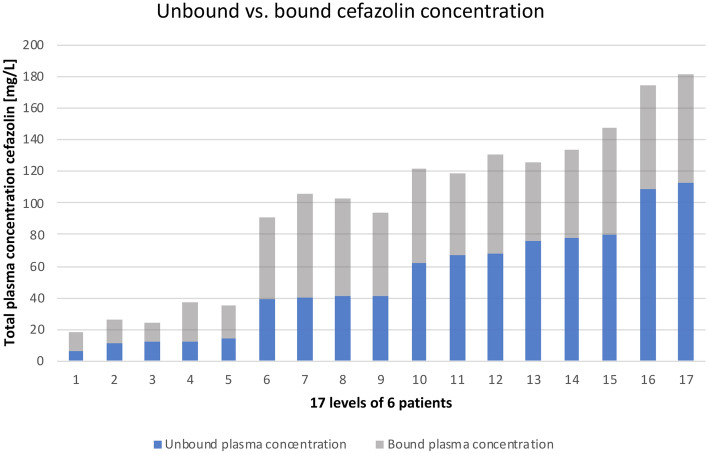
Figure 2.
Unbound versus bound cefazolin concentration. This is a visualization of our measured plasma concentrations of cefazolin in ascending order of the unbound concentration. The y-axis shows the concentration of cefazolin in mg/L. Each bar represents one probe and is divided into the bound fraction (grey) and unbound fraction (blue) of the total cefazolin concentration. This diagram has two key messages: First, the unbound fraction is different in each probe and second, although some probes show high total concentration of cefazolin, the biologically active concentration (= unbound concentration in blue) is lower than in some probes with less total concentration (compare bar 10 and 11).

