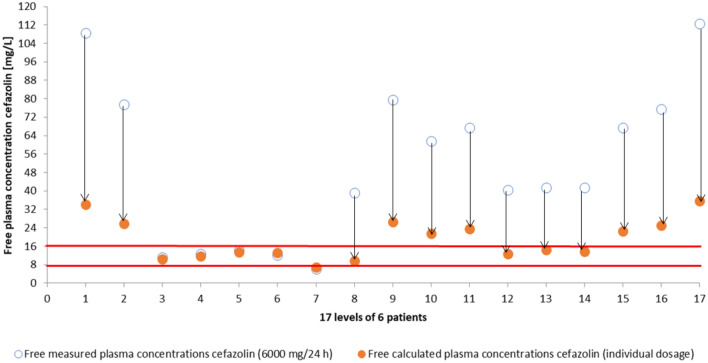
Figure 4.
Effect of dosing software on unbound cefazolin concentration. By entering renal parameters and dialysis settings in a dosing software (thecaddy.de)11 we received a recommended dose of cefazolin for each patient and each day. We were then able to calculate the hypothetical plasma concentration using the recommended dose and the measured cefazolin clearance of that day. This figure shows the actual measured free plasma concentrations of cefazolin (blue circles) using 6000 mg/d and the calculated concentration if we had used dosing software (orange circles). The y-axis shows the free plasma concentration of cefazolin in mg/L and the red lines show the target range of (unbound) cefazolin with 4 times and 8 times ECOFF (2 mg/L).

