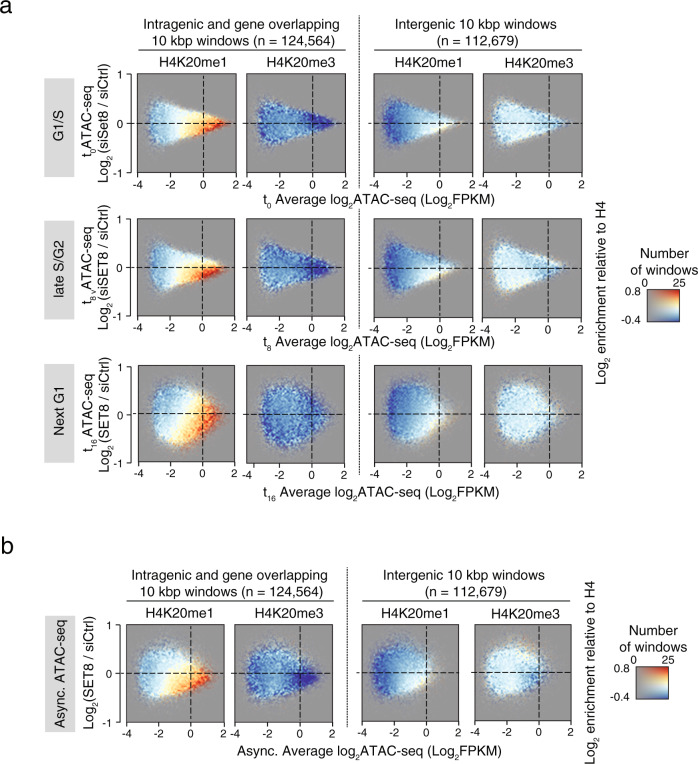
Fig. 2. SET8 ensures chromatin accessibility at genes bodies throughout the cell cycle.
a, b Colored 2D-histograms showing the genome-wide three-way relationship between enrichment of H4K20me1 (color) and the level of ATAC-seq signal in SET8-knockdown (kd) over control-kd in U2OS cells. ChIP-seq and ATAC-seq signal was measured in 10 kbp windows and shown separately for windows overlapping fully or partially with annotated gene bodies (leftmost plots) and the windows that did not overlap (rightmost plots). ATAC-seq signal is plotted as MA-plots with average log2 signal from the two conditions on the X-axis and the log2 difference between SET8-kd and control-kd on the Y-axis. Coloring shows log2 normalized H4K20me1 or H4K20me3 ChIP-seq levels relative to the levels of H4 control ChIP-seq as indicated with the number of windows with a certain combination of ATAC-seq levels (X-axis) and change (Y-axis) controlling opacity as indicated in the right side color scale. Plots shows FPKM-normalized ATAC-seq signal from cells collected at different cell cycle phases as follows: (a) U2OS cells synchronized at G1/S (0 h—top, three replicates), S-G2 (8 h—middle, three replicates) and next G1 phase (16 h—bottom, four replicates), or (b) U2OS cells grown asynchronously (four replicates).

