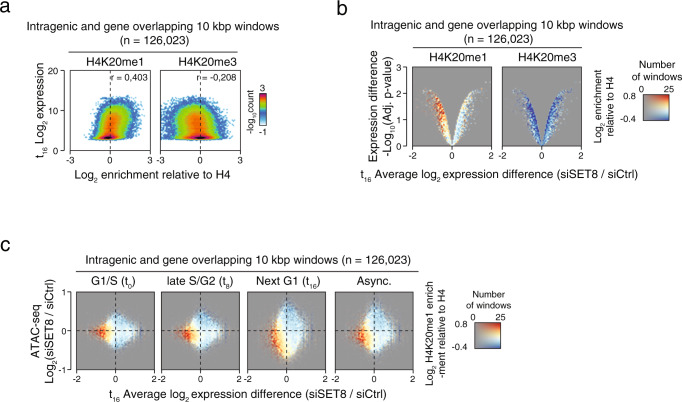
Fig. 3. The SET8-H4K20me1 pathway driven chromatin accessibility promotes transcription.
a 2D-histograms showing the relationship between enrichment of selected H4K20 methylation states (X-axes) and expression assayed by microarrays (Y-axis) at human genes. X-axes shows log2 normalized H4K20me1 (left side) or H4K20me3 (right side) ChIP-seq levels relative to the levels of H4 control ChIP-seq, while Y-axes shows log2-transformed expression levels from synchronized U2OS cells 16 h (G1 phase) after release. The color scales reflect the number of windows having a certain combination of K20me enrichment and expression. r-values shows the Pearson’s correlation coefficients for the data in each plot. b Colored volcano plots showing the three-way relationship between enrichment of selected H4K20 methylation states (color), gene expression difference (X-axis), and significance of the gene expression differences (Y-axis). Coloring shows log2 normalized H4K20me1 (left side) or H4K20me3 (right side) ChIP-seq levels relative to the levels of H4 control. The opacity in the diagram is controlled by the number of genes having the combination of X-axis and Y-axis values as indicated in the right-side color scale. X-axes show log2-transformed difference between SET8-kd over control-kd, and Y-axes show –log10 adjusted p-values from the analysis of the differential expression from two replicates of SET8-kd and three replicates of control-kd in synchronized U2OS cells analysed at 16 h (G1 phase) after release. c Colored 2D-histograms showing the genome-wide three-way relationship between enrichment of H4K20me1 (color), expression changes (X-axis), and ATAC-seq signal changes in SET8-kd over control-kd in synchronized U2OS. ChIP-seq and ATAC-seq signal was measured in 10 kbp windows that overlapped fully or partially with an annotated gene body. ATAC-seq signal and expression differences are plotted the log2 difference between SET8-kd over control-kd. Coloring shows the average log2 normalized H4K20me1 ChIP-seq levels relative to the levels of H4 control ChIP-seq as indicated in the right-side color scale. Opacity reflects the number of windows with a certain combination of expression change (Y-axis) and ATAC-seq change (X-axis) controlling opacity as indicated in the right-side color scale. Plots shows FPKM-normalized ATAC-seq signal from separate rounds of experiments as follows: synchronized U2OS cells at G1/S (0 h—top, three replicates), S-G2 (8 h—middle, three replicates) and next G1 phase (16 h—bottom, four replicates), or U2OS cells grown asynchronously (rightmost, four replicates).

