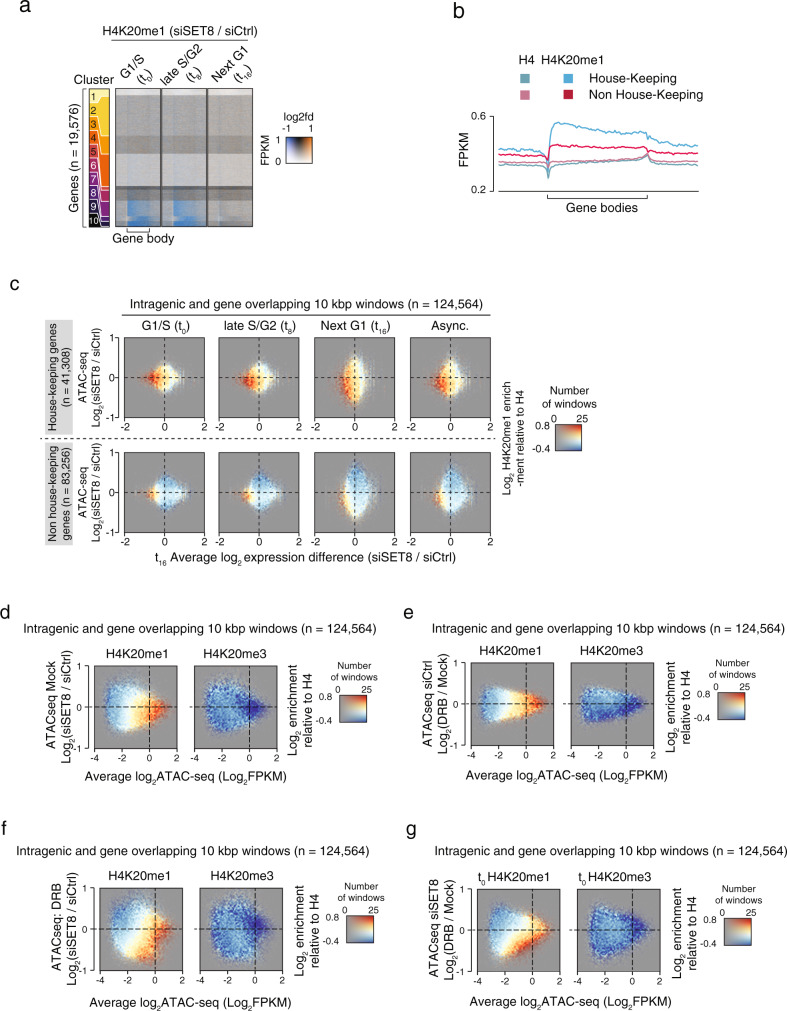
Fig. 4. Transcription of housekeeping genes depends on the SET8-H4K20me1 pathway.
a Heatmaps showing H4K20me1 signal ratios at human genes clustered according to H4K20me1 distribution within the gene bodies in U2OS cells treated with siSET8 and siCtrl. The coloring in the heatmaps is dependent on the total level of signal in both conditions (opacity) and the siSET8/siCtrl ratio, with high and low ratios depicted as orange and blue, respectively. Signal is normalized as FPKMs. Gene bodies are adapted to take up the same visual space regardless of their absolute size in bp, and the horizontal axis in all plots shows the gene bodies as well as upstream and downstream areas corresponding to 50% of gene length. b Plots of the average H4K20me1 and H4 FPKM normalized signals at House-keeping genes and genes that are not House-keeping genes. Gene bodies are adapted to take up the same visual space regardless of their absolute size in bp, and the horizontal axis in all plots shows the gene bodies as well as upstream and downstream areas corresponding to 50% of gene length. c Colored 2D-histograms showing the genome-wide three-way relationship between enrichment of H4K20me1 (color), expression changes (X-axis), and ATAC-seq signal changes in SET8-kd over control-kd in synchronized U2OS as in Fig. 3c. The subset of fully or partially gene overlapping windows from Fig. 3c were further subdivided into one that specifically overlapped with house-keeping genes (upper panels) or non-house-keeping genes (lower panels). d–g Colored 2D-histograms showing the genome-wide relationship between enrichment of H4K20methylation enrichment (color) and the changes in ATAC-seq signal as a consequence of SET8-knockdown in untreated (d) or DRB-treated (f) U2OS cells as well as changes due to DRB-treatment in control (e) or SET8 knockdown (g) U2OS cells. ChIP-seq and ATAC-seq signal was measured in 10kbp windows and shown for windows overlapping fully or partially with annotated gene bodies. ATAC-seq signal is plotted as MA-plots with average log2 signal from the two conditions on the X-axis and the log2 difference between the conditions on the Y-axis. Coloring shows log2 normalized H4K20me1 (right plot) or H4K20me3 (left plot) ChIP-seq levels relative to the levels of H4 control ChIP-seq as indicated, with the number of windows with a certain combination of ATAC-seq levels (X-axis) and change (Y-axis) controlling opacity as indicated in the right side color scale. Plots shows averaged FPKM-normalized ATAC-seq signal from our replicates in each condition of U2OS cells grown asynchronously.

