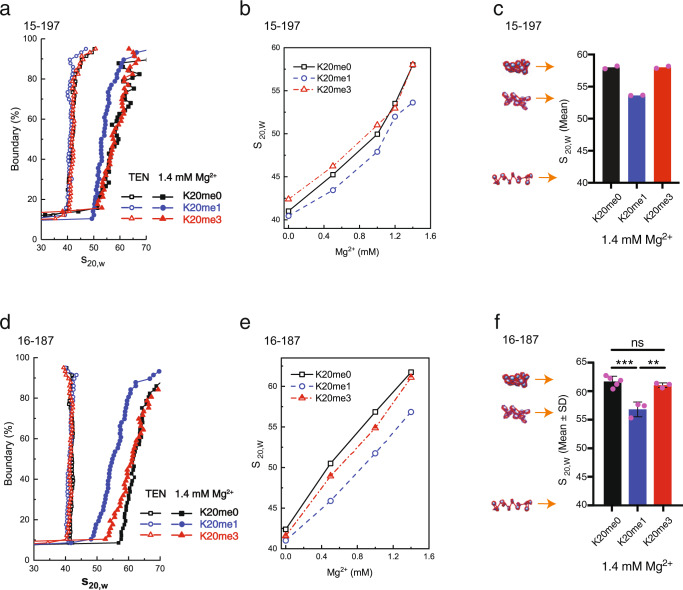
Fig. 5. Histone H4 lysine 20 mono-methylation results in unfolding of 15-197-601 and 16-187-601 nucleosome arrays.
a, d van Holde–Weischet curves showing the boundary distribution curves for the 15-197 (a) and 16-187 nucleosome arrays (d) with the different methylated H4K20 histone constructs in the presence of 1.4 mM Mg2+. b, e AUC-SV titration curves for the 15-197 (b) and 16-187 arrays (e) in the presence of varying amount of Mg2+. Two or three independent sedimentation velocity measurements were performed for each array sample at varying salt concentration. The mean s20,w value was calculated from the s20,w obtained from the average of the values for 20–80% of the boundary curves (corresponding to the curves in a and d). c, f Maximal folding of 15-197 (c) and 16-187 arrays (f) in the presence of 1.4 mM Mg2+ for the three H4K20 methylation states. The baseline (at about s20,w = 40S) corresponds to the result in TEN buffer where the arrays adopt a “beads-on-a-string” extended conformation. Trimethylation (K20me3) has no effect on the maximal folding of arrays. The monomethylated array (K20me1) is unable to reach the maximal folding characterized by an s-value of 58S for 15-197 array and 61S for 16-187 array. One-way ANOVA analysis for different 16-197 arrays was shown (f). Data are presented as mean values +/− SD. ns not significant, p ≥ 0.05; **, 0.001 ≤ p < 0.01; ***, 0.0001 ≤ p < 0.001. For 16-187 array, n = 3 independent experiments for K20me1 and K20me3 arrays; n = 5 for K20me0 array; p = 0.0007 for me0 vs. me1, and p = 0.0056 for me1 vs. me3 (f). The representation of the arrays to the left in c and f schematically illustrates the degree of folding of the arrays. (See the Online Methods section for further details). Source data are provided as a Source Data file.

