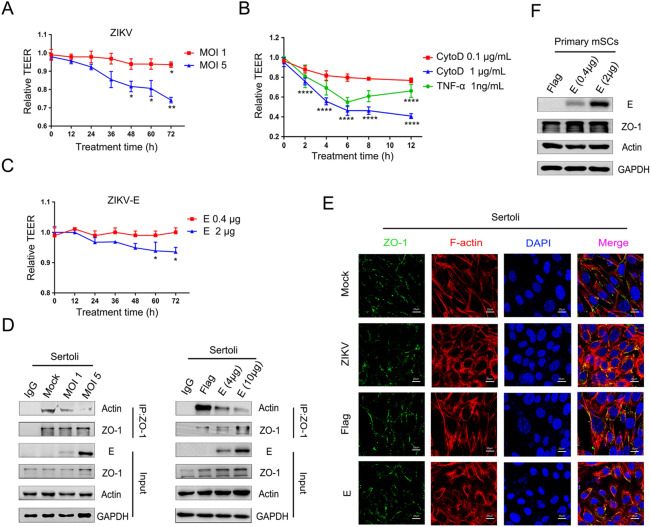
Fig. 5.
ZIKV E participates in the hyperpermeability of the in vitro mSCB model. A Effects of ZIKV infection on in vitro mSCB model. Primary mSCs were cultured on Transwell semipermeable membranes (0.4 μm pore size). Un-treated (mock) or treated with ZIKV at different MOIs when TEER values exceeds 50 Ω • cm2 and remains unchanged, detected TEER values at indicated time. Relative TEER: (Ωexperimental condition − Ωmedium alone)/(Ωmock − Ωmedium alone). The results are representative of three separate experiments. Each value represents the mean ± SD of 3 separate replicates. *, P < 0.05; **, P < 0.01 (two-way ANOVA). B Effects of the CytoD and TNF-α on in vitro mSCB model. CytoD (Control: DMEM containing 0.1% DMSO-treated) and TNF-α (Control: DMEM-treated) were treated on in vitro mSCB model and detected TEER values at indicated time. Relative TEER: (Ωexperimental condition − Ωmedium alone)/(Ωmock − Ωmedium alone). Each value represents the mean ± SD of 3 separate replicates. P values were analysed by comparing with the corresponding controls of 1 μg/mL CytoD and 1 ng/mL TNF-α respectively. ****, P < 0.0001 (two-way ANOVA). C Effects of ZIKV E overexprssion on in vitro mSCB model. Empty vector (mock) or pcDNA3.1(+)-Flag-E plasmid at different concentrations was transfected into mSCs, and TEER values were detected at different time points as indicated. Relative TEER: (Ωexperimental condition − Ωmedium alone)/(Ωmock − Ωmedium alone). The results are representative of three separate experiments. Each value represents the mean ± SD of 3 separate replicates. *, P < 0.05 (two-way ANOVA). D Co-IP of actin and ZO-1 after ZIKV infection and ZIKV E overexprssion. Sertoli cells were cultured overnight in 10 cm dishes, then un-treated (mock) or treated with ZIKV and transfected with empty vector or pcDNA3.1(+)-Flag-E plasmid at different concentrations, samples were collected after 48 h treatment. Cell lysate was immunoprecipitated with anti-ZO-1 or anti-mouse immunoglobulin G (IgG) antibody followed by SDS–PAGE and immunoblotting with anti-actin antibody. E Confocal microscopy analysis of the localization of ZO-1 after ZIKV infection and ZIKV E overexpression. Sertoli cells were un-treated (mock) or treated with ZIKV (MOI = 1) and transfected with 2 μg empty vector or 2 μg pcDNA3.1(+)-Flag-E plasmid. Then cells were fixed after 48 h treatment and stained with DAPI to label nuclei (blue), TRITC-phalloidin to label F-actin (red), and ZO-1 (green) were detected by anti-ZO-1 antibodies. The results are representative of three separate experiments. The scale bar indicates 25 μm. F Identification of E transfection efficiency in primary mSCs. Primary mSCs were transfected with empty vector or pcDNA3.1(+)-Flag-E plasmid and collected at 48 h after transfection, the expression of E, actin and ZO-1 was measured by WB.

