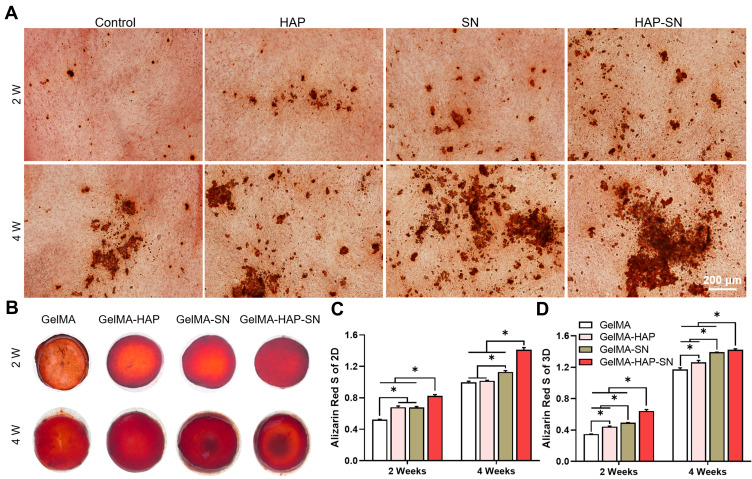
Figure 4.
Matrix mineralization analysis. (A) Depictive images of Alizarin Red staining of the MSCs 2D-cultured with HAP, SN, and HAP + SN on days 14 and 28. (B) Exterior presence of Alizarin Red staining of the MSCs 3D-cultured with GelMA, GelMA-HAP, GelMA-SN, and GelMA-HAP-SN hydrogel on days 14 and 28. (C–D) Quantification analysis of the calcium deposits in nanoparticle-based-2D-cultured and GelMA-based-3D-cultured surroundings on days 14 and 28, respectively. *P < 0.05 indicates statistical difference.

