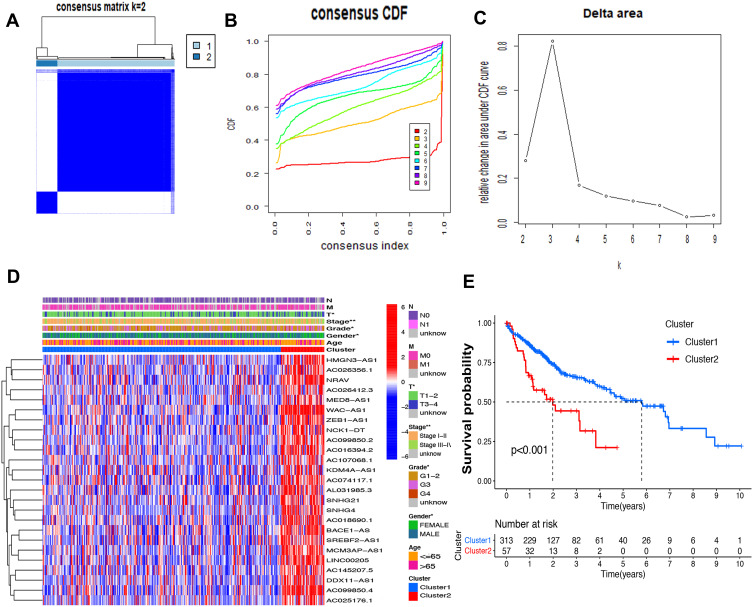
Figure 3.
Differential survival outcomes of HCC in Cluster 1/2 subtypes. (A) Consensus score matrix of all samples when k=2. (B) The cumulative distribution functions (CDF) for k=2 to 9. (C) Relative change in area under CDF area for k=2 to 9. (D) Heatmap of clinicopathological features and different lncRNA expression pattern in Cluster 1/2. (E) Survival analysis of Cluster 1/2 in the total TCGA cohort. *P<0.05, **P<0.01.

