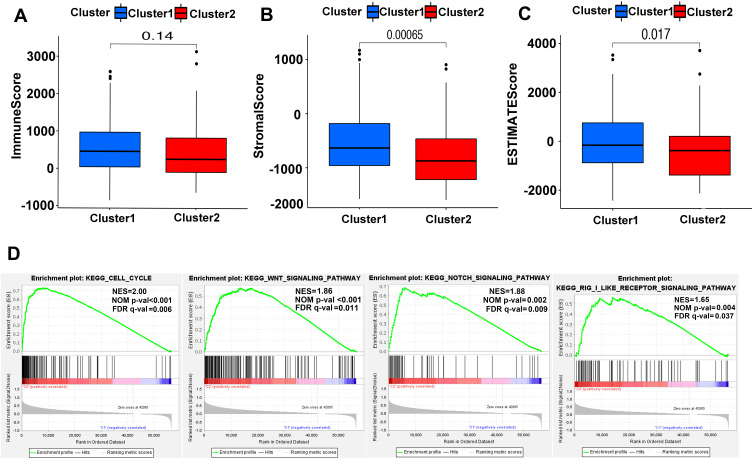
Figure 5.
ESTIMATE and GSEA analysis in Cluster 1/2. (A–C) Comparison of immune score (A), stromal score (B) and ESTIMATE score (C) in two subtypes. (D) GSEA showed that cell cycle, Wnt signaling pathway, notch signaling pathway and RIG-1-like receptor signaling pathway are differentially enriched in Cluster 2. NES, normalized enrichment score; NOM p-val, normalized P-value; FDR q value: false discovery rate q value.

