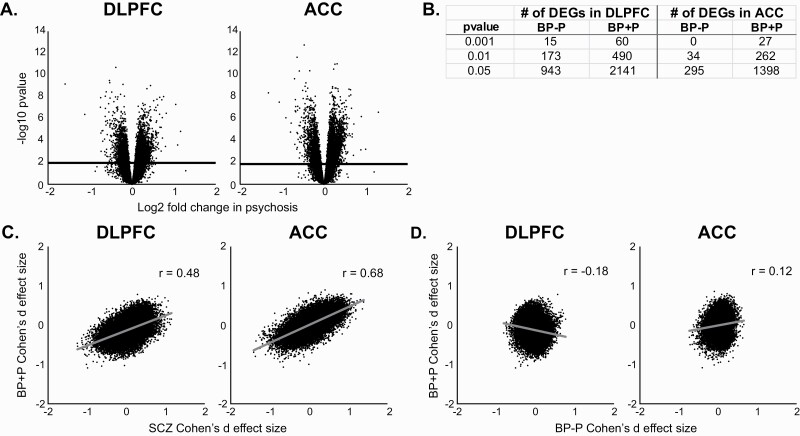
Fig. 2.
Association of psychosis with differential gene expression. (A) Volcano plots showing the log2 fold change in subjects with psychosis for dorsolateral prefrontal (DLPFC; left) and anterior cingulate (ACC) samples (right). Solid horizontal line represents the Benjamini–Hochberg-corrected P value of .05. (B) Number of differentially expressed genes in bipolar disorder subjects with psychosis (BP + P) versus bipolar disorder subjects without psychosis (BP − P) at various P-value thresholds in DLPFC and ACC. (C) Correlations between Cohen’s d effect sizes for schizophrenia and BP + P subjects for DLPFC (left) and ACC samples (right). (D) Correlations between Cohen’s d effect sizes for BP − P and BP + P subjects for DLPFC (left) and ACC samples (right).

