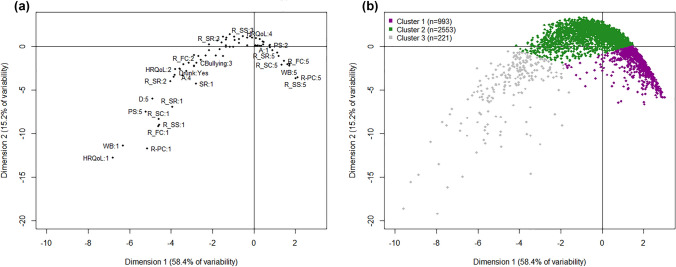
Fig. 1.
Graphical representation of the two dimensions of the multiple correspondence analysis (MCA) and the cluster analysis. a Black dots represent the categories of mental health variables and the conduct problems included in the MCA; only the most representative entries are labeled as "scale: category". The closer the points, the stronger the association between them. The categories are numbered from the lowest response options of the scale, 1, to the highest option (depending on the variable, from 3 to 5). Average values are around the middle of the map. The first dimension identified the gradient of mental health status, from the worst values (left) to the best values (right), and it explains 58.4% of the variability. The second dimension identifies the extreme values of the scales (down) and explains 15.2% of the variability. WB mental well-being, HRQoL health-related quality of life (KIDSCREEN-10), R-PC resilience-personal competence, R-SC resilience-social competence, R-SS resilience-structured style, R-SR resilience-social resources, R-FC resilience-family cohesion, SR school resilience, PS perceived stress, D depression, A anxiety disorder, Fight involved in a physical fight during last 12 months, Bullying involved bullying others during last 2 months, CBullied cyber-bullied during last 2 months, CBullying involved in cyber-bullying others during last 2 months, Bullied bullied during last 2 months, Smoking ever-smoked tobacco, Drinking ever drunk alcohol, Drunk ever become very drunk, Cannabis ever used cannabis. b Cluster 1: represents the distribution of adolescents with "good mental health"; Cluster 2: adolescents with "intermediate mental health"; and Cluster 3: participants with "poor mental health"

