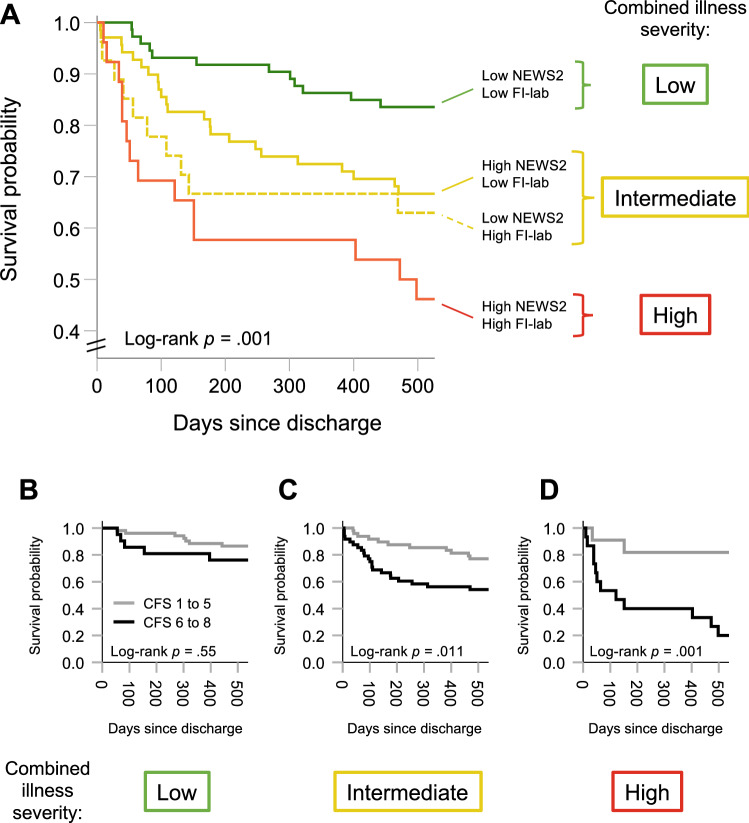
Fig. 3.
a Kaplan–Meier curves display estimated survival probabilities within follow-up according to four categories of NEWS2 and FI-lab scores (high or low). Visual inspection suggests more favourable survival for patients with less severe illness. A log-rank test confirmed a significant difference between the survival curves. To visualize the interaction between NEWS2 and FI-lab categories and frailty, subjects were divided based a combined illness severity pattern emphasized by color: we considered low NEWS2 and FI-lab scores (green curve) as low; high NEWS2 (straight line) or FI-lab (dotted line) as intermediate (yellow curves); and high NEWS2 and FI-lab as high combined illness severity (red curve), respectively. b–d shows Kaplan–Meier plots of estimated survival probabilities for subjects living with no to mild (CFS 1–5; grey curves) or moderate to severe (CFS 6–8; black curves) frailty––stratified according to low, intermediate or high combined illness severity. Visual inspection of the curves indicates negligible differences in survival across categories of illness severity among patients living with no or mild frailty. The curves further suggests that the impact of living with moderate to severe frailty on survival probability is most pronounced in the face of more severe illness

