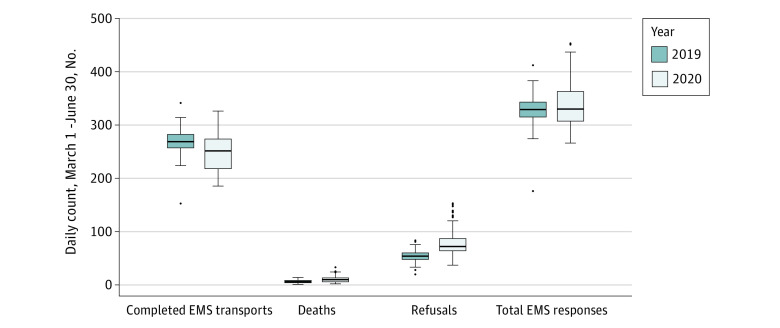
Figure 1. Emergency Medical Services (EMS) Use.
Total EMS responses, completed EMS to hospital transports, prehospital deaths, and refusals of emergently indicated EMS transport in 2019 vs 2020, reported as daily count for March 1 to June 30, 2020. EMS to hospital transports equal total EMS responses minus prehospital deaths and refusals. Solid line indicates median; box, interquartile range (IQR); whiskers, 1.5 times the IQR; and individual dots, outliers.

