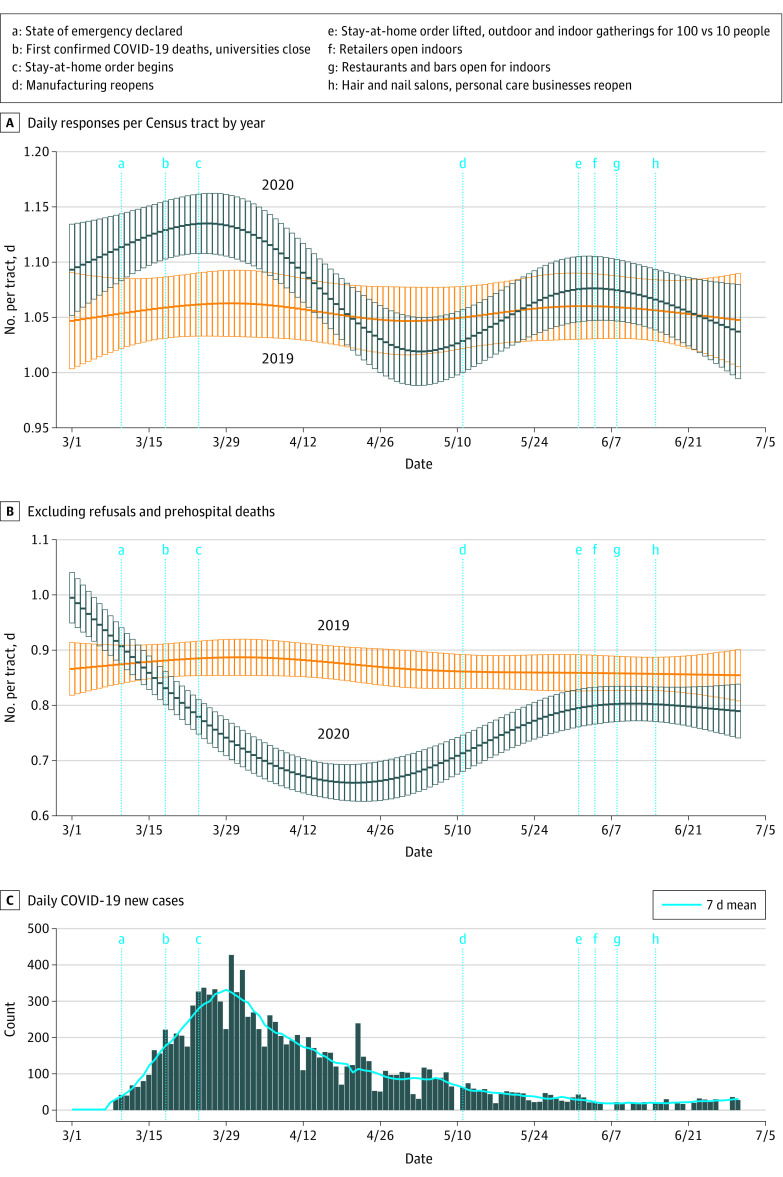
Figure 2. Emergency Medical Services Responses Over Time.
A, Multivariable-adjusted mean daily count per Census tract for emergency medical services responses. B, Daily counts excluding emergency medical services refusals and prehospital deaths. C, New daily cases of COVID-19 (bars) and 7-day moving average (solid blue line) are shown for the same Census tracts across the same dates. Counts with error bars (95% CIs) are shown for each day in the study period. Major milestones in public health restrictions being initiated (a-c) or relaxed (d-h) are indicated by vertical blue lines across all 3 graphs.

