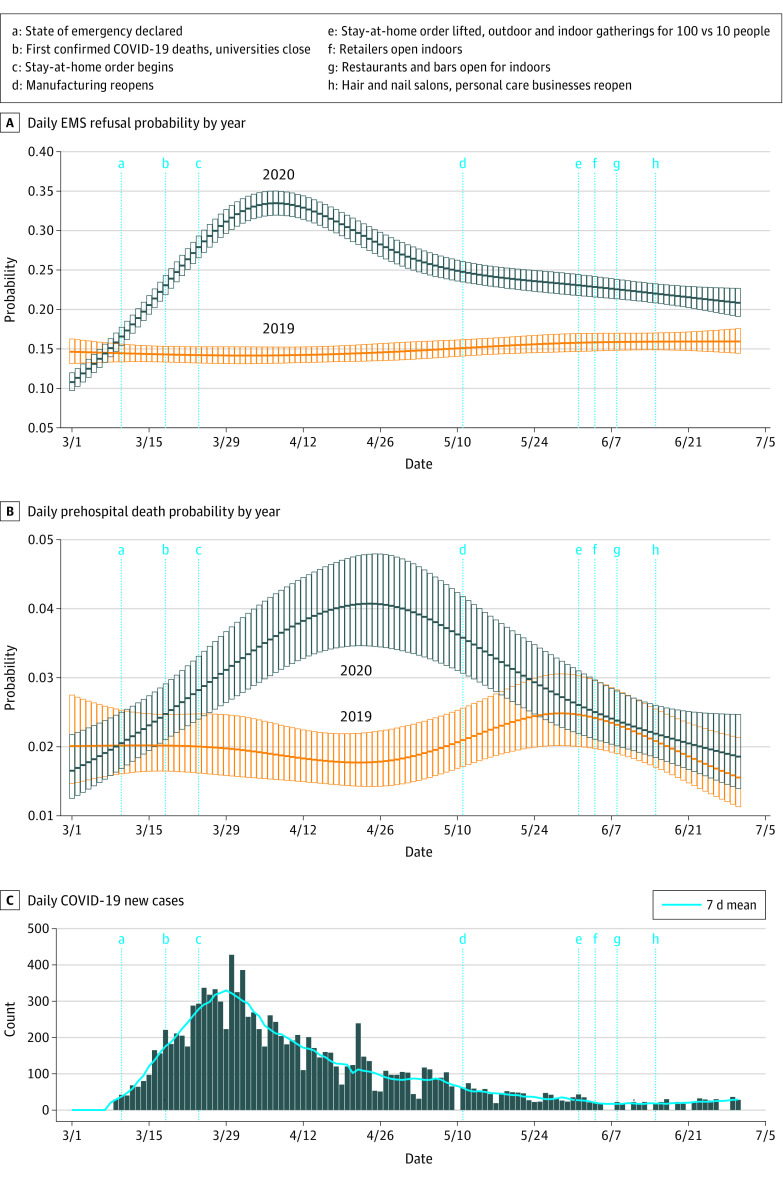
Figure 3. Emergency Medical Services (EMS) Probability of Refusal or Transport.
Multivariable-adjusted mean daily probability for an EMS response ending in voluntary refusal of emergency transport (A) or prehospital death (B) from March to June 2019 and 2020. The probability of refusal was for all EMS responses in which EMS transport was completed or voluntarily refused (ie, prehospital deaths are excluded in panel A). Prehospital death probability is for all EMS responses resulting in completed transport or prehospital death (ie, excludes refusals). Probability with error bars (95% CI) are shown for each day in the study period. C, COVID-19 new daily cases (bars) and 7-day moving average (solid blue line) are shown for the same Census tracts across the same dates. The trend of 2020 probability of prehospital death follows the trend in COVID-19 incidence closely, with peaks and decreases delayed by a few weeks; 2020 deaths approximate the 2019 baseline as COVID-19 incidence and public health restrictions reach a nadir. Conversely, refusal probability shows a more modest decrease after the COVID-19 peak and little change in response to reopening events (d-h).

